
The Transportation Safety Board of Canada (TSB) gathers and uses transportation occurrenceSee the Definitions section. data as part of its investigations to analyze safety deficiencies and identify risks in the Canadian air transportation system.
This statistical summary serves to describe the accident, incident, and injury counts that are presented in the included Tables. It provides limited discussion and some context but is not intended to be an in-depth analysis of the data. Averages and percentages in this summary have been rounded.
It should be noted that certain characteristics of the data constrain statistical analysis and the identification of emerging trends. These include the small totals of accidents and incidents, the large variability in the data from year to year, and changes to regulations and definitions. The reader is cautioned to keep these limitations in mind when reading this summary to avoid drawing conclusions that cannot be supported by statistical analysis.
The 2025 data were collected according to the reporting requirements described in the Transportation Safety Board Regulations in force during that calendar year.
The statistics presented here reflect the TSB Marine Safety Information System (MARSIS) database at 30 March 2026. Since the occurrence data are constantly being updated in the live database, the statistics may change slightly over time.
Also, as many occurrences are limited to data gathering, information recorded on some occurrences may not have been verified.
The following discussion refers to data tables contained in this document.
Executive summary
The TSB received 990 reports of marine transportation occurrences in 2025 (257 accidents and 733 incidents), including 6 fatalities.
The total of 257 marine transportation accidents represents an increase from the 213 accidents in 2024 but is 4% below the 10-year average of 267. In 2025, 85% were shipping accidents (when a ship, for example, sinks, founders, or capsizes), slightly more than 83% on average over the previous 10 years. The remaining 15% of accidents in 2025 were aboard ship (when a person is seriously or fatally injured, for example, when boarding a ship or by falling overboard), just below the 10-year annual average of 17%.
According to information provided by Transport Canada, marine activity for Canadian commercial non-fishing vessels over 15 gross tons (GT) was 23 732 thousand commercial vessel-km in 2025, which is 11% above the 2015–2024 average. This yields a rate of 3.1 shipping accidents per million commercial vessel-km in 2025, lower than the prior 10-year average of 3.3.
The 6 marine transportation fatalities represent a 50% reduction from the 2024 total of 12 and a reduction from the 10-year average of 15. Of the 6 fatalities, 3 involved shipping accidents, below the average of 9 per year. As in previous years, many of the fatalities (3 of the 6) were related to commercial fishing (Canadian-flag vessels in Canadian waters). Due to this continuing trend, commercial fishing safety remains a key safety issue on the TSB’s Watchlist.
The 733 marine transportation incidents reported to the TSB in 2025 represents a 1% decrease from 2024 and is 13% below the 10-year average of 842. As in previous years, most reportable incidents (82%) were related to the total failure of machinery or technical systems.
Accidents
Overview of accidents and casualties
In 2025, 257 marine accidentsSee the Definitions section. were reported to the TSB, a higher number compared to the 2024 total of 213 but below the 10-year (2015 to 2024) average of 267 (Figure 1). In 2025, the proportion of shipping accidents (as opposed to accidents aboard ship) was 85% of all marine accidents, slightly higher than the previous 10-year average proportion (83%).
There were 218 shipping accidents in 2025, which is more than the 2024 total of 183 but slightly less (2%) than the 2015 to 2024 average of 222. Fishing vessels were involved in 31% of all shipping accidents, which is the highest proportion among vessel types, followed by solid cargo vessels, involved in 23% of shipping accidents (data not shown).
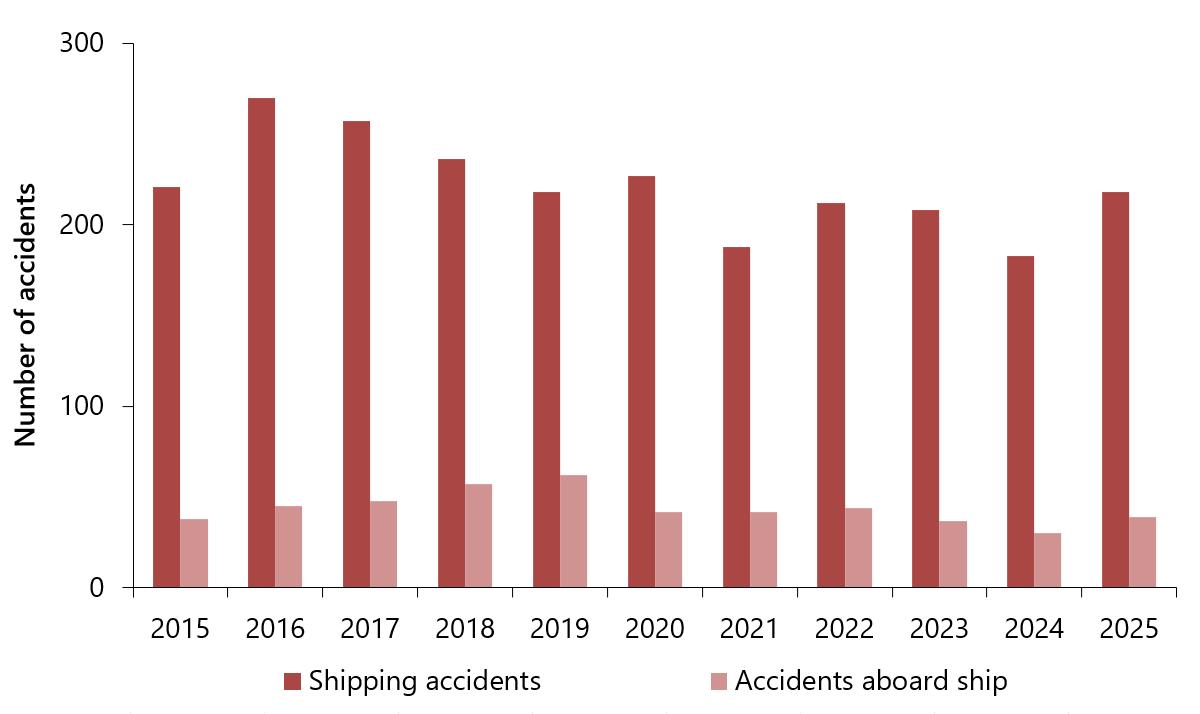
Figure 1. Data table
| Number of shipping accidents and accidents aboard ship by year | Shipping accidents | Accidents aboard ship |
|---|---|---|
| 2015 | 221 | 38 |
| 2016 | 270 | 45 |
| 2017 | 257 | 48 |
| 2018 | 236 | 57 |
| 2019 | 218 | 62 |
| 2020 | 227 | 42 |
| 2021 | 188 | 42 |
| 2022 | 212 | 44 |
| 2023 | 208 | 37 |
| 2024 | 183 | 30 |
| 2025 | 218 | 39 |
In 2025, there were 39 accidents aboard ship, more than in 2024 (30), but down from the 2015 to 2024 average of 45. Fishing vessels were involved in 23% of all accidents aboard ship, down from 50% in 2024. Solid cargo vessels were involved in 44% of accidents aboard ship (data not shown).
Casualties (tables 1, 6 and 7)
In 2025, 6 marine fatalities were reported, down from the 12 fatalities reported in 2024, and below the annual average of 15 between 2015 and 2024. Of the 6 fatalities in 2025, 3 were the result of 2 shipping accidents, while the remaining 3 fatalities resulted from 3 accidents aboard ship.
Of note, 2 shipping accident fatalities in 2025 and 1 fatality that ensued from an accident aboard ship occurred aboard commercial fishing vessels. Improving safety in the commercial fishing industry is an ongoing concern of the Transportation Safety Board of Canada.
Serious injuries in 2025 totalled 45, up from 38 in 2024, but slightly below the annual average of 47 from 2015 to 2024. Of these 45 serious injuries, 37 (82%) resulted from accidents aboard ship, and 8 resulted from shipping accidents (Figure 2).

Figure 2. Data table
| Number of marine fatalities and injuries by year | Fatalities | Injuries |
|---|---|---|
| 2015 | 19 | 45 |
| 2016 | 8 | 49 |
| 2017 | 11 | 49 |
| 2018 | 22 | 61 |
| 2019 | 17 | 57 |
| 2020 | 18 | 41 |
| 2021 | 11 | 45 |
| 2022 | 9 | 41 |
| 2023 | 18 | 39 |
| 2024 | 12 | 38 |
| 2025 | 6 | 45 |
Shipping accidents
Type of accident (Table 1)
As illustrated in Figure 3, the most frequent types of shipping accidents in 2025 were collisions (28% of all accident types reported), grounding (25%) and fire/explosion (19%). The total number of collisions (62) was 18% below the 10-year (2015-2024) average of 76, the number of groundings (55) was only 1% over the 10-year average of 54 and the number of fire/explosion accidents (41) was 10% over the 10-year average of 37.
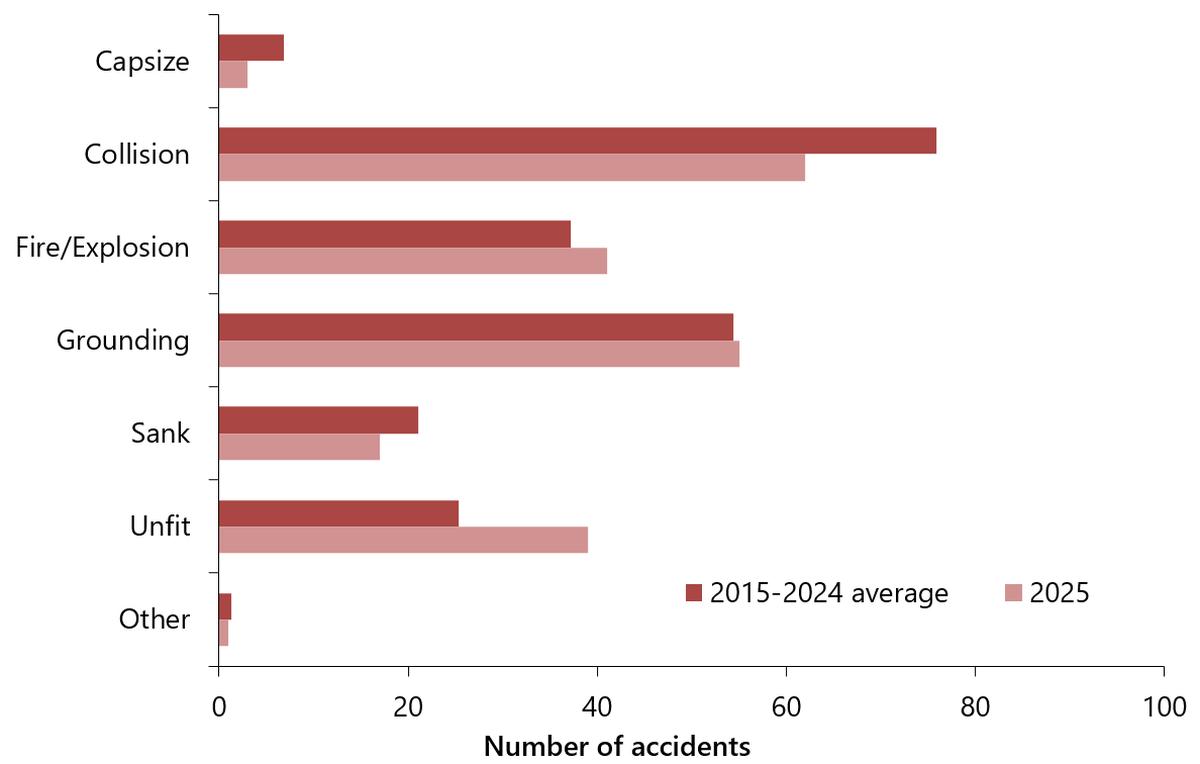
Figure 3. Data table
| Number of shipping accidents by accident type | 2015-2024 average | 2025 |
|---|---|---|
| Capsize | 7 | 3 |
| Collision | 76 | 62 |
| Fire/Explosion | 37 | 41 |
| Grounding | 54 | 55 |
| Sank | 21 | 17 |
| Unfit | 25 | 39 |
| Other | 1 | 1 |
Type of vessel (Table 1)
The total number of fishing vessels (71) involved in shipping accidents in 2025 was significantly higher compared to 56 in 2024, but close to the 2015 to 2024 average of 72 (Figure 4). Fishing vessels represented 29% of all vessels involved in shipping accidents.

Figure 4. Data table
| Number vessels involved in shipping accidents by type of vessels | 2015-2024 average | 2025 |
|---|---|---|
| Barge | 19 | 11 |
| Cargo - liquid | 8 | 13 |
| Cargo - solid | 48 | 50 |
| Ferry | 17 | 11 |
| Fishing | 72 | 71 |
| Passenger | 14 | 21 |
| Service ship | 31 | 28 |
| Tug | 22 | 24 |
| Other | 25 | 14 |
Geographical region (Table 2)
In 2025, 34% of shipping accidents occurred in the Pacific region, 31% in the Atlantic region, and 29% in the Central region. About 5% of shipping accidents were reported in foreign waters.See the Definitions section. In the Pacific region in 2025, the number of shipping accidents (75) dropped 21% below the 2015–2024 average of 96. In the Central region shipping accidents (64) were only 1% below the 2015–2024 average of 65, while In the Atlantic region, the number of shipping accidents (68) was 24% above the 2015–2024 average of 55 (Figure 5).
In 2025, fishing vessels were more often involved in shipping accidents in the Atlantic region (49 fishing vessels, up from the 2015–2024 average of 36), and in the Pacific region (18 fishing vessels, below the 2015–2024 average of 30). As for the Central region, most of the vessels involved in shipping accidents were of cargo/tanker vessel type (34), equivalent to the 2015–2024 average of 34 (Table 2).
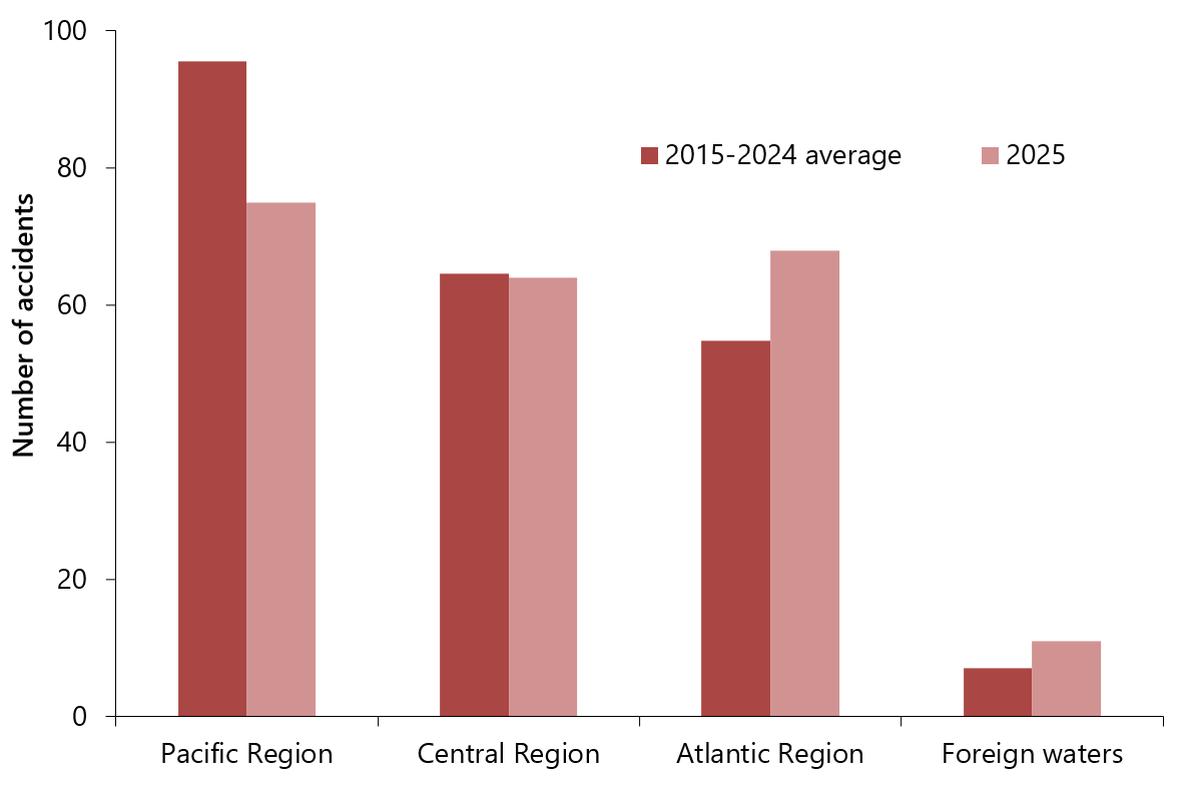
Figure 5. Data table
| Number of shipping accidents by region | 2015-2024 average | 2025 |
|---|---|---|
| Pacific Region | 96 | 75 |
| Central Region | 65 | 64 |
| Atlantic Region | 55 | 68 |
| Foreign waters | 7 | 11 |
Vessel flag (tables 1, 3, and 4)
In 2025, 81% of the 243 vessels involved in shipping accidents reported to the TSB were Canadian-flag vessels. Of these 196 Canadian-flag vessels, 48% were commercial non-fishing vessels and 36% were fishing vessels; the remaining 16% were non-commercial vessels, pleasure craft or service vessels.
Accident rates
Canadian-flag commercial non-fishing vessels were most often involved in collisions (37%), groundings (27%), or fire/explosions (19%) (Table 3). According to information provided by Transport Canada,Source: Transport Canada, Transportation and Economic Analysis – Policy Group, email communication 24 April 2026. marine activity for Canadian commercial non-fishing vessels over 15 gross tons (GT) was 23 732 thousand commercial vessel-km in 2025, which is 11% above the 2015–2024 average.Transport Canada (TC) has updated its methodology for measuring commercial activity. Beginning from 2013, TC combines terrestrial automatic identification system (AIS) data from the Canadian Coast Guard and satellite AIS data from the Government of Canada Satellite AIS provider to calculate a distance-based metric of Canadian-flag commercial marine activity in Canadian waters. (Source: Transports Canada, “An introduction to automatic identification system (AIS) data & how it’s used at TC (OPP)”, December 2019). This yields a rate of 3.1 shipping accidents per million commercial vessel-km in 2025, lower than the prior 10-year average of 3.3.
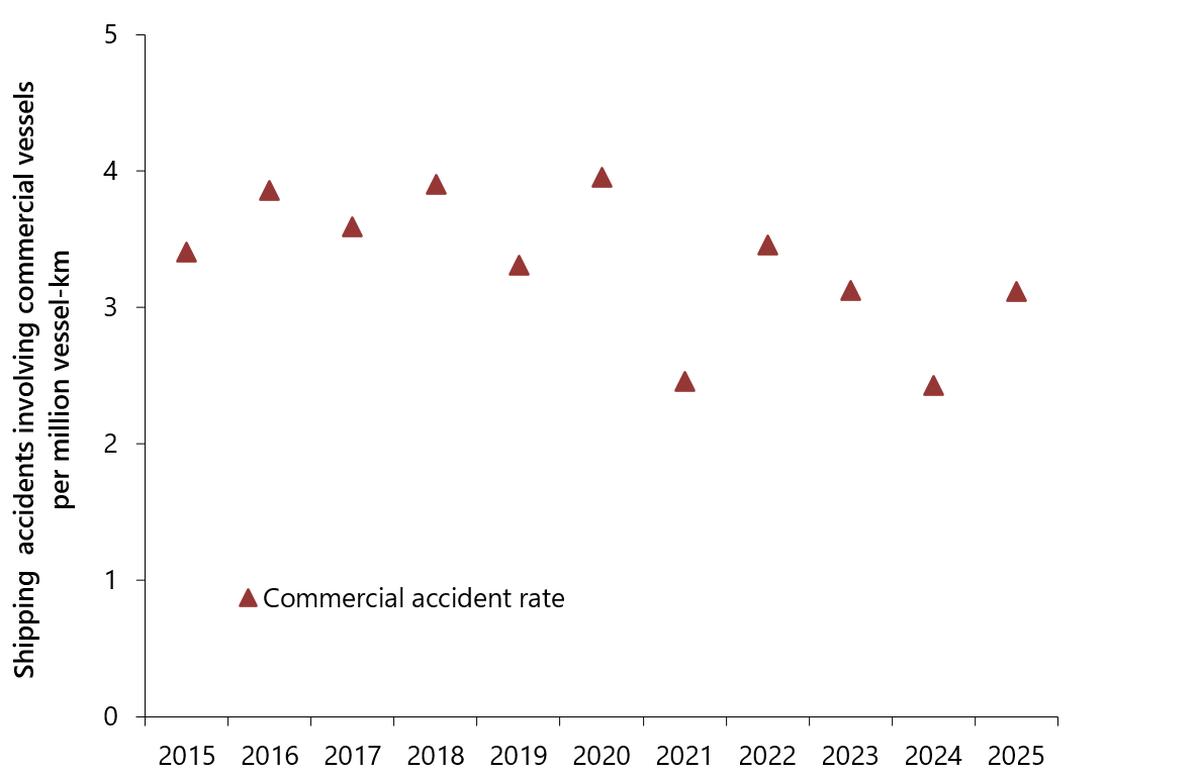
Figure 6. Data table
| Shipping accident rates for Canadian-flag commercial non-fishing vessels | Commercial accident rate |
|---|---|
| 2015 | 3.4 |
| 2016 | 3.9 |
| 2017 | 3.6 |
| 2018 | 3.9 |
| 2019 | 3.3 |
| 2020 | 3.9 |
| 2021 | 2.5 |
| 2022 | 3.5 |
| 2023 | 3.1 |
| 2024 | 2.4 |
| 2025 | 3.1 |
To test whether the change in rate was statistically significant, Kendall’s tau-b (τb) correlation was calculated to quantify the trend in accident rate. Kendall's τb correlation coefficient is a nonparametric measure of the strength and direction of association that exists between two variables. Kendall’s τb was calculated on the 11-year series of accident rate values by year from 2015 to 2025. For the period represented in this summary, any linear change in the accident rate was not statistically significant (τb = −0.4182, p = 0.073).
For Canadian-flag fishing vessels, the most frequently reported shipping accident types in 2025 were grounding (32%), sustains damage rendering vessel unseaworthy/unfit (24%), and sinking (15%) (Table 3). According to information provided by Transport Canada, there were 10 483 active fishing vessels in Canada in 2025.Source: Transport Canada, Transportation and Economic Analysis – Policy Group, email communication 24 April 2026. The shipping accident rate for Canadian-flag fishing vessels (Figure 7) was 6.5 shipping accidents per 1000 active fishing vessels in 2025, above the rate of 4.7 in 2024, and above the 2015–2024 average of 5.2.
Once again, Kendall’s τb for this series (Canadian-flag fishing vessel accident rate) was not significant (τb = −0.3091, p = 0.186).
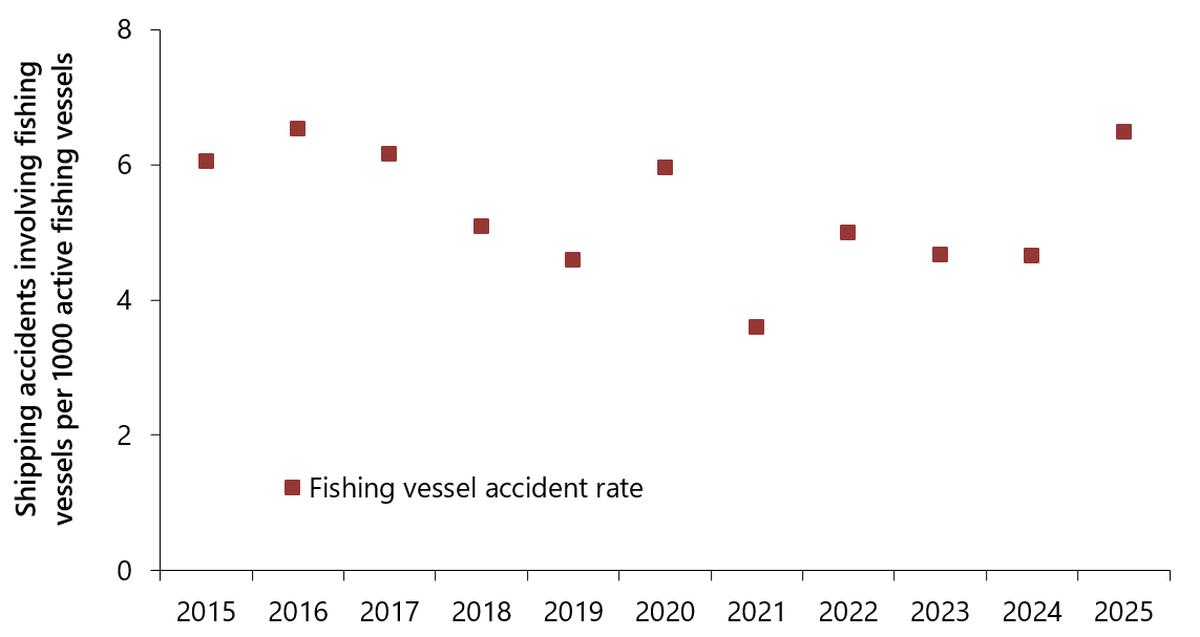
Figure 7. Data table
| Shipping accident rates for Canadian-flag fishing vessels | Fishing vessel accident rate |
|---|---|
| 2015 | 6.0 |
| 2016 | 6.5 |
| 2017 | 6.1 |
| 2018 | 5.1 |
| 2019 | 4.6 |
| 2020 | 5.9 |
| 2021 | 3.6 |
| 2022 | 5.0 |
| 2023 | 4.7 |
| 2024 | 4.7 |
| 2025 | 6.5 |
In 2025, 37 foreign-flag vessels were involved in shipping accidents in Canadian waters, 36 of which were commercial non-fishing vessels (Table 4). According to information provided by Transport Canada,Source: Transport Canada, Transportation and Economic Analysis – Policy Group, email communication 24 April 2026. marine activity for foreign commercial non-fishing vessels over 15 GT was 29 378 thousand commercial vessel-km in 2025, above the 2015–2024 average of 25 758 thousand commercial vessel-km. This yields an accident rate of 1.2 shipping accidents involving commercial foreign-flag vessels over 15 GT per million commercial vessel-km, up from the 2015–2024 average (0.9).
Vessels lost (tables 1 and 5)
In 2025, 13 vessels were reported lost, fewer than in 2024 (18) and below the 2015–2024 average of 16. Ten of the 13 vessels lost in 2025 were fishing vessels. Seven of the 13 vessels lost were less than 15 GT and for 2 vessels the tonnage was not known. In the previous 10 years (2015 to 2024), fishing vessels under 60 GT have accounted for 68% of Canadian vessels lost (tables 1 and 5, some data not shown).
Incidents
Overview of incidents
In 2025, 733 marine incidents were reported to the TSB, slightly down from the total of 737 in 2024 and below the annual 10-year (2015-2024) average of 842.In 2014, the TSB issued new regulations that changed reporting requirements for some types of incidents, leading to an increase in incidents since that time. Incidents in the Atlantic region (346) represented 47% of all marine incidents, followed by 32% (235) in the Central region, and 18% (135) in the Pacific region. The remaining 2% (17) of reported incidents occurred in foreign waters (Table 2).
The majority (82%) of reportable incidents involved the total failure of any machinery or technical system (Figure 8).The 2014 changes in reporting requirements applied to those involving a total failure of any machinery or technical system, leading to an increase in incidents of this category since then. The largest proportion of these incidents (54%) occurred in the Atlantic region, while the greatest proportion of incidents involving risk of collision (80%) occurred in the Central region (data not shown). The types of vessel most often involved in total failure of any machinery or technical systems incidents in 2025 were fishing vessels (63%) and solid cargo vessels (18%) (data not shown).
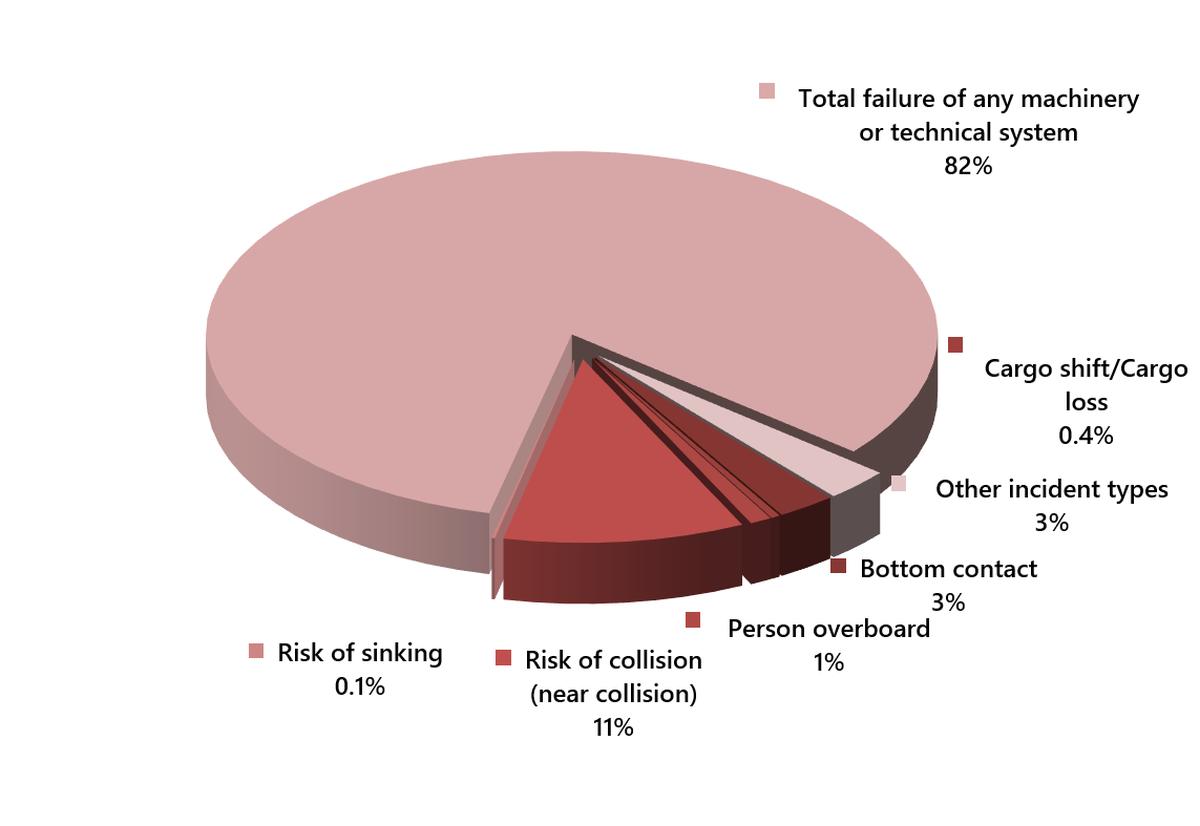
Figure 8. Data table
| Marine Incidents by Type | Number | Percentage |
|---|---|---|
| Bottom contact | 19 | 3% |
| Cargo shift/Cargo loss | 3 | 0% |
| Person overboard | 7 | 1% |
| Risk of collision (near collision) | 78 | 11% |
| Risk of sinking | 1 | 0% |
| Total failure of any machinery or technical system | 604 | 82% |
| Other incident types | 21 | 3% |
* Due to rounding of percentages in category labels, additions across incident types should be calculated from Table 1 data rather than by adding percentages shown in Figure 8.
Data tables
| 2015 | 2016 | 2017 | 2018 | 2019 | 2020 | 2021 | 2022 | 2023 | 2024 | 2025 | |
|---|---|---|---|---|---|---|---|---|---|---|---|
| Accidents | 259 | 315 | 305 | 293 | 280 | 269 | 230 | 256 | 245 | 213 | 257 |
| Shipping accidents by type | 221 | 270 | 257 | 236 | 218 | 227 | 188 | 212 | 208 | 183 | 218 |
| Capsize | 10 | 7 | 6 | 10 | 9 | 2 | 4 | 9 | 3 | 8 | 3 |
| Collision | 57 | 92 | 94 | 83 | 77 | 97 | 58 | 67 | 73 | 61 | 62 |
| Fire/Explosion | 34 | 44 | 38 | 35 | 34 | 38 | 46 | 33 | 33 | 37 | 41 |
| Grounding | 62 | 66 | 60 | 58 | 54 | 49 | 40 | 58 | 50 | 47 | 55 |
| Sank | 17 | 27 | 22 | 27 | 18 | 21 | 23 | 29 | 16 | 11 | 17 |
| Sustains damage rendering vessel unseaworthy/unfit for purpose | 39 | 33 | 36 | 23 | 26 | 19 | 14 | 16 | 31 | 16 | 39 |
| Other shipping accident types | 2 | 1 | 1 | 0 | 0 | 1 | 3 | 0 | 2 | 3 | 1 |
| Accidents aboard ship | 38 | 45 | 48 | 57 | 62 | 42 | 42 | 44 | 37 | 30 | 39 |
| Vessels involved in shipping accidents | 249 | 317 | 295 | 271 | 244 | 263 | 212 | 244 | 241 | 208 | 243 |
| Barge | 13 | 24 | 23 | 29 | 19 | 25 | 15 | 20 | 16 | 8 | 11 |
| Cargo - liquid | 12 | 8 | 13 | 9 | 7 | 6 | 5 | 5 | 5 | 5 | 13 |
| Cargo - solid | 38 | 41 | 42 | 48 | 59 | 64 | 43 | 50 | 61 | 32 | 50 |
| Ferry | 18 | 20 | 12 | 10 | 18 | 16 | 19 | 23 | 15 | 16 | 11 |
| Fishing | 85 | 95 | 96 | 77 | 62 | 80 | 51 | 64 | 57 | 56 | 71 |
| Passenger | 18 | 15 | 17 | 15 | 21 | 12 | 9 | 12 | 9 | 9 | 21 |
| Service ship | 29 | 50 | 41 | 27 | 23 | 20 | 18 | 28 | 32 | 38 | 28 |
| Tug | 19 | 26 | 29 | 25 | 10 | 22 | 24 | 19 | 20 | 22 | 24 |
| Other vessel types | 17 | 38 | 22 | 31 | 25 | 18 | 28 | 23 | 26 | 22 | 14 |
| Vessels involved in shipping accidents | 249 | 317 | 295 | 271 | 244 | 263 | 212 | 244 | 241 | 208 | 243 |
| Canadian non-fishing vessels | 132 | 187 | 161 | 157 | 134 | 143 | 124 | 143 | 135 | 126 | 135 |
| Canadian fishing vessels | 84 | 93 | 90 | 72 | 59 | 77 | 48 | 63 | 55 | 55 | 71 |
| Foreign vessels | 33 | 37 | 44 | 42 | 51 | 43 | 40 | 38 | 51 | 27 | 37 |
| Vessels lost | 24 | 19 | 14 | 15 | 9 | 14 | 16 | 16 | 13 | 18 | 13 |
| 1600 GT and over | 0 | 0 | 0 | 1 | 0 | 0 | 0 | 1 | 0 | 1 | 0 |
| 150 to 1599 GT | 2 | 1 | 0 | 0 | 0 | 0 | 2 | 0 | 1 | 1 | 1 |
| 60 to 149 GT | 6 | 5 | 2 | 4 | 1 | 3 | 0 | 1 | 2 | 1 | 2 |
| 15 to 59 GT | 6 | 2 | 4 | 3 | 1 | 3 | 4 | 4 | 1 | 5 | 1 |
| Less than 15 GT | 9 | 7 | 5 | 6 | 7 | 7 | 6 | 6 | 3 | 7 | 7 |
| Unknown tonnage | 1 | 4 | 3 | 1 | 0 | 1 | 4 | 4 | 6 | 3 | 2 |
| Persons fatally injured | 19 | 8 | 11 | 22 | 17 | 18 | 11 | 9 | 18 | 12 | 6 |
| Shipping accidents | 13 | 6 | 4 | 14 | 9 | 14 | 9 | 4 | 10 | 9 | 3 |
| Accidents aboard ship | 6 | 2 | 7 | 8 | 8 | 4 | 2 | 5 | 8 | 3 | 3 |
| Persons seriously injured | 45 | 49 | 49 | 61 | 57 | 41 | 45 | 41 | 39 | 38 | 45 |
| Shipping accidents | 12 | 5 | 7 | 8 | 10 | 2 | 9 | 7 | 7 | 8 | 8 |
| Accidents aboard ship | 33 | 44 | 42 | 53 | 47 | 39 | 36 | 34 | 32 | 30 | 37 |
| Occurrences with a dangerous good release | 5 | 6 | 7 | 8 | 2 | 4 | 1 | 12 | 3 | 1 | 0 |
| Reportable incidents | 698 | 760 | 859 | 927 | 936 | 921 | 847 | 957 | 782 | 737 | 733 |
| Bottom contact | 32 | 22 | 38 | 33 | 29 | 14 | 20 | 31 | 33 | 20 | 19 |
| Cargo shift/Cargo loss | 5 | 4 | 6 | 7 | 3 | 3 | 4 | 2 | 2 | 3 | 3 |
| Person overboard | 10 | 8 | 9 | 11 | 14 | 5 | 5 | 13 | 5 | 5 | 7 |
| Risk of collision (near collision) | 31 | 45 | 52 | 67 | 54 | 66 | 35 | 63 | 63 | 64 | 78 |
| Risk of sinking | 10 | 20 | 14 | 34 | 14 | 31 | 30 | 26 | 24 | 11 | 1 |
| Total failure of any machinery or technical system | 587 | 633 | 700 | 730 | 792 | 753 | 723 | 783 | 627 | 611 | 604 |
| Other incident types | 23 | 28 | 40 | 45 | 30 | 49 | 30 | 39 | 28 | 23 | 21 |
| Data extracted 30 March 2026 | |||||||||||
| 2015 | 2016 | 2017 | 2018 | 2019 | 2020 | 2021 | 2022 | 2023 | 2024 | 2025 | |
|---|---|---|---|---|---|---|---|---|---|---|---|
| Pacific region | |||||||||||
| Shipping accidents | 92 | 139 | 119 | 102 | 85 | 87 | 84 | 98 | 82 | 67 | 75 |
| Accidents aboard ship | 14 | 20 | 9 | 12 | 14 | 15 | 13 | 8 | 12 | 6 | 12 |
| Vessels involved in shipping accidents | 108 | 165 | 139 | 120 | 99 | 103 | 98 | 112 | 95 | 76 | 87 |
| Barge/Tug | 23 | 39 | 36 | 37 | 20 | 30 | 24 | 21 | 23 | 19 | 22 |
| Cargo/Tanker | 6 | 14 | 9 | 8 | 13 | 16 | 11 | 12 | 11 | 6 | 13 |
| Ferry/Passenger | 15 | 17 | 13 | 13 | 16 | 10 | 17 | 17 | 12 | 8 | 18 |
| Fishing | 35 | 44 | 38 | 31 | 25 | 25 | 20 | 33 | 23 | 22 | 18 |
| Other vessel types | 29 | 51 | 43 | 31 | 25 | 22 | 26 | 29 | 26 | 21 | 16 |
| Vessels lost | 12 | 9 | 9 | 3 | 3 | 5 | 6 | 7 | 3 | 4 | 5 |
| Fatalities | 12 | 0 | 6 | 7 | 8 | 4 | 2 | 3 | 5 | 4 | 1 |
| Reportable incidents | 257 | 288 | 274 | 253 | 229 | 256 | 248 | 270 | 223 | 170 | 135 |
| Central region | |||||||||||
| Shipping accidents | 67 | 58 | 68 | 64 | 70 | 73 | 60 | 64 | 71 | 51 | 64 |
| Accidents aboard ship | 10 | 11 | 16 | 21 | 20 | 17 | 15 | 21 | 12 | 11 | 15 |
| Vessels involved in shipping accidents | 75 | 68 | 76 | 72 | 77 | 84 | 67 | 77 | 85 | 59 | 69 |
| Barge/Tug | 9 | 9 | 12 | 8 | 7 | 10 | 13 | 15 | 10 | 6 | 10 |
| Cargo/Tanker | 36 | 25 | 31 | 36 | 39 | 41 | 28 | 37 | 44 | 22 | 34 |
| Ferry/Passenger | 13 | 9 | 11 | 10 | 18 | 11 | 10 | 11 | 9 | 10 | 9 |
| Fishing | 6 | 6 | 14 | 8 | 1 | 14 | 3 | 3 | 7 | 2 | 3 |
| Other vessel types | 11 | 19 | 8 | 10 | 12 | 8 | 13 | 11 | 15 | 19 | 13 |
| Vessels lost | 2 | 2 | 0 | 2 | 0 | 1 | 2 | 1 | 4 | 5 | 2 |
| Fatalities | 2 | 0 | 3 | 1 | 3 | 1 | 2 | 2 | 3 | 0 | 1 |
| Reportable incidents | 113 | 124 | 194 | 272 | 282 | 282 | 238 | 332 | 240 | 211 | 235 |
| Atlantic region | |||||||||||
| Shipping accidents | 57 | 65 | 63 | 55 | 55 | 56 | 43 | 46 | 50 | 58 | 68 |
| Accidents aboard ship | 14 | 14 | 19 | 22 | 24 | 9 | 12 | 14 | 11 | 13 | 12 |
| Vessels involved in shipping accidents | 60 | 74 | 71 | 63 | 60 | 63 | 46 | 51 | 55 | 65 | 76 |
| Barge/Tug | 0 | 1 | 1 | 5 | 2 | 4 | 2 | 3 | 3 | 3 | 3 |
| Cargo/Tanker | 2 | 3 | 11 | 4 | 6 | 4 | 8 | 3 | 7 | 4 | 8 |
| Ferry/Passenger | 8 | 9 | 5 | 2 | 5 | 7 | 1 | 7 | 2 | 7 | 4 |
| Fishing | 44 | 45 | 43 | 36 | 36 | 41 | 28 | 28 | 26 | 32 | 49 |
| Other vessel types | 6 | 16 | 11 | 16 | 11 | 7 | 7 | 10 | 17 | 19 | 12 |
| Vessels lost | 10 | 8 | 5 | 10 | 6 | 8 | 8 | 8 | 5 | 9 | 6 |
| Fatalities | 5 | 8 | 2 | 13 | 6 | 13 | 7 | 4 | 10 | 8 | 4 |
| Reportable incidents | 316 | 335 | 378 | 390 | 408 | 372 | 352 | 347 | 303 | 345 | 346 |
| Foreign waters | |||||||||||
| Shipping accidents | 5 | 8 | 7 | 15 | 8 | 11 | 1 | 4 | 5 | 7 | 11 |
| Accidents aboard ship | 0 | 0 | 4 | 2 | 4 | 1 | 2 | 1 | 2 | 0 | 0 |
| Vessels involved in shipping accidents | 6 | 10 | 9 | 16 | 8 | 13 | 1 | 4 | 6 | 8 | 11 |
| Barge/Tug | 0 | 1 | 3 | 4 | 0 | 3 | 0 | 0 | 0 | 2 | 0 |
| Cargo/Tanker | 6 | 7 | 4 | 9 | 8 | 9 | 1 | 3 | 4 | 5 | 8 |
| Ferry/Passenger | 0 | 0 | 0 | 0 | 0 | 0 | 0 | 0 | 1 | 0 | 1 |
| Fishing | 0 | 0 | 1 | 2 | 0 | 0 | 0 | 0 | 1 | 0 | 1 |
| Other vessel types | 0 | 2 | 1 | 1 | 0 | 1 | 0 | 1 | 0 | 1 | 1 |
| Vessels lost | 0 | 0 | 0 | 0 | 0 | 0 | 0 | 0 | 1 | 0 | 0 |
| Fatalities | 0 | 0 | 0 | 1 | 0 | 0 | 0 | 0 | 0 | 0 | 0 |
| Reportable incidents | 12 | 13 | 13 | 12 | 17 | 11 | 9 | 8 | 16 | 11 | 17 |
Data extracted 30 March 2026 1 See the map of the regions in the Definitions section of the statistical summary. | |||||||||||
| 2015 | 2016 | 2017 | 2018 | 2019 | 2020 | 2021 | 2022 | 2023 | 2024 | 2025 | |
|---|---|---|---|---|---|---|---|---|---|---|---|
| Canadian-flag vessels involved | 201 | 247 | 228 | 197 | 173 | 205 | 145 | 185 | 165 | 162 | 196 |
| Commercial vessels | 88 | 102 | 99 | 100 | 86 | 104 | 77 | 92 | 76 | 66 | 94 |
| Capsize | 3 | 2 | 1 | 2 | 1 | 1 | 1 | 2 | 0 | 1 | 1 |
| Collision | 34 | 50 | 48 | 49 | 46 | 64 | 37 | 47 | 43 | 30 | 35 |
| Fire/Explosion | 12 | 14 | 9 | 14 | 14 | 8 | 13 | 14 | 9 | 11 | 18 |
| Grounding | 16 | 21 | 21 | 16 | 14 | 15 | 15 | 19 | 12 | 14 | 25 |
| Sank | 10 | 5 | 5 | 5 | 3 | 6 | 7 | 4 | 2 | 2 | 4 |
| Sustains damage rendering vessel unseaworthy/unfit for purpose | 13 | 10 | 15 | 14 | 8 | 10 | 4 | 6 | 9 | 8 | 11 |
| Other shipping accident types | 0 | 0 | 0 | 0 | 0 | 0 | 0 | 0 | 1 | 0 | 0 |
| Commercial vessel-km (thousands)1 | 19,974 | 19,461 | 21,192 | 21,546 | 22,042 | 20,258 | 22,388 | 21,977 | 22,110 | 22,644 | 23,732 |
| Commercial accidents per million vessel-km2 | 3.4 | 3.9 | 3.6 | 3.9 | 3.3 | 3.9 | 2.5 | 3.5 | 3.1 | 2.4 | 3.1 |
| Fishing vessels | 82 | 91 | 86 | 70 | 59 | 77 | 45 | 61 | 55 | 55 | 71 |
| Capsize | 5 | 3 | 2 | 4 | 2 | 1 | 2 | 2 | 1 | 6 | 1 |
| Collision | 4 | 12 | 19 | 12 | 7 | 17 | 4 | 3 | 6 | 8 | 9 |
| Fire/Explosion | 14 | 16 | 16 | 6 | 10 | 20 | 16 | 10 | 13 | 9 | 9 |
| Grounding | 35 | 32 | 29 | 33 | 27 | 26 | 13 | 25 | 21 | 24 | 23 |
| Sank | 10 | 17 | 8 | 9 | 7 | 10 | 5 | 17 | 6 | 5 | 11 |
| Sustains damage rendering vessel unseaworthy/unfit for purpose | 12 | 10 | 11 | 6 | 6 | 2 | 3 | 4 | 8 | 1 | 17 |
| Other shipping accident types | 2 | 1 | 1 | 0 | 0 | 1 | 2 | 0 | 0 | 2 | 1 |
| Active fishing vessels3 | 13,227 | 13,341 | 13,174 | 13,182 | 12,861 | 12,440 | 12,266 | 11,838 | 11,791 | 11,603 | 10,483 |
| Fishing vessel accident rate4 | 6.0 | 6.5 | 6.1 | 5.1 | 4.6 | 5.9 | 3.6 | 5.0 | 4.7 | 4.7 | 6.5 |
| Other vessels | 31 | 54 | 43 | 27 | 28 | 24 | 23 | 32 | 34 | 41 | 31 |
| Capsize | 1 | 1 | 1 | 1 | 1 | 0 | 1 | 1 | 0 | 1 | 0 |
| Collision | 15 | 25 | 26 | 14 | 13 | 8 | 4 | 16 | 13 | 19 | 10 |
| Fire/Explosion | 3 | 14 | 5 | 10 | 3 | 9 | 9 | 6 | 8 | 11 | 9 |
| Grounding | 8 | 7 | 2 | 1 | 3 | 4 | 3 | 6 | 9 | 5 | 5 |
| Sank | 0 | 3 | 6 | 1 | 5 | 2 | 3 | 3 | 2 | 3 | 2 |
| Sustains damage rendering vessel unseaworthy/unfit for purpose | 4 | 4 | 3 | 0 | 3 | 1 | 3 | 0 | 2 | 1 | 5 |
| Other shipping accident types | 0 | 0 | 0 | 0 | 0 | 0 | 0 | 0 | 0 | 1 | 0 |
Data extracted 30 March 2026 1 Transport Canada (TC) has updated its methodology for measuring commercial marine activity. Beginning from 2013, TC combines terrestrial automatic identification system (AIS) data from the Canadian Coast Guard and satellite AIS data from the Government of Canada Satellite AIS provider to calculate a distance-based metric of commercial activity in Canadian waters. However, not all vessels are equipped with AIS transponders. The TSB estimates total vessel-km based on data received from TC. (Sources: TC email communications 15 April 2021, 20 March 2026). | |||||||||||
| 2015 | 2016 | 2017 | 2018 | 2019 | 2020 | 2021 | 2022 | 2023 | 2024 | 2025 | |
|---|---|---|---|---|---|---|---|---|---|---|---|
| Foreign-flag vessels involved | 33 | 37 | 44 | 42 | 51 | 43 | 40 | 38 | 51 | 27 | 37 |
| Commercial vessels | 30 | 32 | 37 | 32 | 46 | 40 | 37 | 37 | 48 | 26 | 36 |
| Capsize | 0 | 0 | 0 | 0 | 0 | 0 | 0 | 0 | 0 | 0 | 0 |
| Collision | 11 | 17 | 21 | 24 | 26 | 30 | 21 | 21 | 27 | 14 | 24 |
| Fire/Explosion | 5 | 0 | 4 | 3 | 6 | 0 | 6 | 2 | 3 | 5 | 4 |
| Grounding | 4 | 8 | 6 | 2 | 6 | 4 | 7 | 7 | 6 | 3 | 3 |
| Sank | 0 | 1 | 0 | 0 | 0 | 0 | 0 | 1 | 0 | 0 | 0 |
| Sustains damage render unseaworthy/ unfit for purpose | 10 | 6 | 6 | 3 | 8 | 6 | 3 | 6 | 12 | 4 | 5 |
| Other shipping accident types | 0 | 0 | 0 | 0 | 0 | 0 | 0 | 0 | 0 | 0 | 0 |
| Commercial vessel-km (thousands)3 | 23,463 | 22,435 | 25,789 | 27,003 | 26,578 | 24,216 | 26,173 | 26,686 | 26,400 | 28,837 | 29,378 |
| Commercial accidents per million vessel-kms4 | 1.2 | 1.3 | 1.4 | 1.2 | 1.6 | 1.5 | 1.4 | 1.3 | 1.8 | 0.9 | 1.2 |
| Fishing vessels | 1 | 2 | 6 | 5 | 3 | 3 | 3 | 1 | 2 | 1 | 0 |
| Capsize | 0 | 0 | 0 | 0 | 0 | 0 | 0 | 0 | 0 | 0 | 0 |
| Collision | 0 | 1 | 2 | 1 | 0 | 2 | 0 | 1 | 1 | 1 | 0 |
| Fire/Explosion | 0 | 0 | 1 | 1 | 1 | 0 | 1 | 0 | 0 | 0 | 0 |
| Grounding | 1 | 1 | 2 | 2 | 1 | 1 | 0 | 0 | 0 | 0 | 0 |
| Sank | 0 | 0 | 0 | 1 | 0 | 0 | 2 | 0 | 0 | 0 | 0 |
| Sustains damage render unseaworthy/ unfit for purpose | 0 | 0 | 1 | 0 | 1 | 0 | 0 | 0 | 0 | 0 | 0 |
| Other shipping accident types | 0 | 0 | 0 | 0 | 0 | 0 | 0 | 0 | 1 | 0 | 0 |
| Other vessels | 2 | 3 | 1 | 5 | 2 | 0 | 0 | 0 | 1 | 0 | 1 |
| Capsize | 1 | 0 | 0 | 1 | 0 | 0 | 0 | 0 | 0 | 0 | 0 |
| Collision | 1 | 2 | 0 | 2 | 2 | 0 | 0 | 0 | 1 | 0 | 0 |
| Fire/Explosion | 0 | 0 | 1 | 1 | 0 | 0 | 0 | 0 | 0 | 0 | 0 |
| Grounding | 0 | 1 | 0 | 0 | 0 | 0 | 0 | 0 | 0 | 0 | 0 |
| Sank | 0 | 0 | 0 | 0 | 0 | 0 | 0 | 0 | 0 | 0 | 0 |
| Sustains damage render unseaworthy/ unfit for purpose | 0 | 0 | 0 | 1 | 0 | 0 | 0 | 0 | 0 | 0 | 1 |
| Other shipping accident types | 0 | 0 | 0 | 0 | 0 | 0 | 0 | 0 | 0 | 0 | 0 |
Data extracted 30 March 2026 1 Transport Canada (TC) has updated its methodology for measuring commercial marine activity. Beginning from 2013, TC combines terrestrial automatic identification system (AIS) data from the Canadian Coast Guard and satellite AIS data from the Government of Canada Satellite AIS provider to calculate a distance-based metric of commercial activity in Canadian waters. (Sources: TC email communications 15 April 2021, 20 March 2026). | |||||||||||
| 2015 | 2016 | 2017 | 2018 | 2019 | 2020 | 2021 | 2022 | 2023 | 2024 | 2025 | |
|---|---|---|---|---|---|---|---|---|---|---|---|
| Vessels lost | 24 | 19 | 14 | 15 | 9 | 14 | 16 | 16 | 13 | 18 | 13 |
| 0-4 years | 1 | 0 | 0 | 0 | 1 | 0 | 1 | 0 | 0 | 0 | 0 |
| 5-9 years | 0 | 0 | 0 | 1 | 0 | 0 | 0 | 0 | 0 | 0 | 0 |
| 10-14 years | 3 | 0 | 0 | 2 | 0 | 0 | 1 | 0 | 1 | 2 | 0 |
| 15-19 years | 1 | 3 | 2 | 2 | 1 | 2 | 1 | 2 | 0 | 0 | 0 |
| 20-24 years | 1 | 0 | 0 | 1 | 1 | 0 | 2 | 1 | 1 | 7 | 2 |
| 25-29 years | 5 | 1 | 0 | 3 | 0 | 0 | 1 | 1 | 0 | 1 | 0 |
| 30+ years | 10 | 7 | 7 | 3 | 1 | 6 | 5 | 5 | 3 | 2 | 5 |
| Unknown | 3 | 8 | 5 | 3 | 5 | 6 | 5 | 7 | 8 | 6 | 6 |
| Commercial vessels | 8 | 4 | 2 | 3 | 0 | 1 | 3 | 3 | 2 | 2 | 1 |
| 0-4 years | 0 | 0 | 0 | 0 | 0 | 0 | 1 | 0 | 0 | 0 | 0 |
| 5-9 years | 0 | 0 | 0 | 1 | 0 | 0 | 0 | 0 | 0 | 0 | 0 |
| 10-14 years | 0 | 0 | 0 | 0 | 0 | 0 | 0 | 0 | 0 | 0 | 0 |
| 15-19 years | 0 | 1 | 0 | 0 | 0 | 0 | 0 | 1 | 0 | 0 | 0 |
| 20-24 years | 1 | 0 | 0 | 0 | 0 | 0 | 0 | 0 | 0 | 0 | 0 |
| 25-29 years | 2 | 0 | 0 | 0 | 0 | 0 | 0 | 0 | 0 | 1 | 0 |
| 30+ years | 4 | 2 | 1 | 1 | 0 | 0 | 2 | 1 | 1 | 1 | 0 |
| Unknown | 1 | 1 | 1 | 1 | 0 | 1 | 0 | 1 | 1 | 0 | 1 |
| Fishing vessels | 16 | 14 | 9 | 12 | 6 | 12 | 11 | 11 | 5 | 11 | 10 |
| 0-4 years | 1 | 0 | 0 | 0 | 0 | 0 | 0 | 0 | 0 | 0 | 0 |
| 5-9 years | 0 | 0 | 0 | 0 | 0 | 0 | 0 | 0 | 0 | 0 | 0 |
| 10-14 years | 3 | 0 | 0 | 2 | 0 | 0 | 0 | 0 | 1 | 2 | 0 |
| 15-19 years | 1 | 2 | 2 | 2 | 1 | 2 | 1 | 1 | 0 | 0 | 0 |
| 20-24 years | 0 | 0 | 0 | 1 | 1 | 0 | 2 | 1 | 1 | 7 | 2 |
| 25-29 years | 3 | 1 | 0 | 3 | 0 | 0 | 1 | 1 | 0 | 0 | 0 |
| 30+ years | 6 | 5 | 6 | 2 | 0 | 6 | 3 | 4 | 2 | 1 | 5 |
| Unknown | 2 | 6 | 1 | 2 | 4 | 4 | 4 | 4 | 1 | 1 | 3 |
| Other vessels | 0 | 1 | 3 | 0 | 3 | 1 | 2 | 2 | 6 | 5 | 2 |
| 0-4 years | 0 | 0 | 0 | 0 | 1 | 0 | 0 | 0 | 0 | 0 | 0 |
| 5-9 years | 0 | 0 | 0 | 0 | 0 | 0 | 0 | 0 | 0 | 0 | 0 |
| 10-14 years | 0 | 0 | 0 | 0 | 0 | 0 | 1 | 0 | 0 | 0 | 0 |
| 15-19 years | 0 | 0 | 0 | 0 | 0 | 0 | 0 | 0 | 0 | 0 | 0 |
| 20-24 years | 0 | 0 | 0 | 0 | 0 | 0 | 0 | 0 | 0 | 0 | 0 |
| 25-29 years | 0 | 0 | 0 | 0 | 0 | 0 | 0 | 0 | 0 | 0 | 0 |
| 30+ years | 0 | 0 | 0 | 0 | 1 | 0 | 0 | 0 | 0 | 0 | 0 |
| Unknown | 0 | 1 | 3 | 0 | 1 | 1 | 1 | 2 | 6 | 5 | 2 |
| Data extracted 30 March 2026 |
| 2015 | 2016 | 2017 | 2018 | 2019 | 2020 | 2021 | 2022 | 2023 | 2024 | 2025 | |
|---|---|---|---|---|---|---|---|---|---|---|---|
| Shipping accidents with fatalities1 or serious injuries | 7 | 5 | 8 | 12 | 9 | 7 | 9 | 7 | 9 | 10 | 6 |
| Capsize | 2 | 1 | 1 | 5 | 3 | 0 | 3 | 0 | 2 | 2 | 1 |
| Collision | 2 | 2 | 4 | 1 | 2 | 2 | 1 | 2 | 4 | 3 | 2 |
| Fire/Explosion | 1 | 1 | 1 | 1 | 1 | 0 | 2 | 0 | 0 | 0 | 0 |
| Grounding | 1 | 0 | 0 | 3 | 1 | 1 | 0 | 2 | 0 | 2 | 2 |
| Sank | 1 | 1 | 2 | 2 | 2 | 3 | 2 | 3 | 2 | 1 | 1 |
| Sustains damage rendering unseaworthy/ unfit for purpose | 0 | 0 | 0 | 0 | 0 | 0 | 0 | 0 | 0 | 0 | 0 |
| Other shipping accident types | 0 | 0 | 0 | 0 | 0 | 1 | 1 | 0 | 1 | 2 | 0 |
| Persons fatally injured in shipping accidents | 13 | 6 | 4 | 14 | 9 | 14 | 9 | 4 | 10 | 9 | 3 |
| Capsize | 9 | 2 | 1 | 7 | 7 | 0 | 4 | 0 | 2 | 3 | 1 |
| Collision | 1 | 0 | 0 | 2 | 1 | 0 | 0 | 0 | 1 | 0 | 0 |
| Fire/Explosion | 0 | 0 | 0 | 0 | 0 | 0 | 0 | 0 | 0 | 0 | 0 |
| Grounding | 0 | 0 | 0 | 1 | 0 | 1 | 0 | 0 | 0 | 0 | 0 |
| Sank | 3 | 4 | 3 | 4 | 1 | 9 | 3 | 4 | 6 | 1 | 2 |
| Sustains damage rendering unseaworthy/ unfit for purpose | 0 | 0 | 0 | 0 | 0 | 0 | 0 | 0 | 0 | 0 | 0 |
| Other shipping accident types | 0 | 0 | 0 | 0 | 0 | 4 | 2 | 0 | 1 | 5 | 0 |
| Persons seriously injured in shipping accidents | 12 | 5 | 7 | 8 | 10 | 2 | 9 | 7 | 7 | 8 | 8 |
| Capsize | 0 | 0 | 0 | 1 | 0 | 0 | 2 | 0 | 0 | 0 | 0 |
| Collision | 9 | 4 | 6 | 0 | 4 | 2 | 1 | 2 | 4 | 6 | 4 |
| Fire/Explosion | 1 | 1 | 1 | 5 | 1 | 0 | 5 | 0 | 0 | 0 | 0 |
| Grounding | 2 | 0 | 0 | 2 | 4 | 0 | 0 | 5 | 0 | 2 | 2 |
| Sank | 0 | 0 | 0 | 0 | 1 | 0 | 1 | 0 | 3 | 0 | 2 |
| Sustains damage rendering unseaworthy/ unfit for purpose | 0 | 0 | 0 | 0 | 0 | 0 | 0 | 0 | 0 | 0 | 0 |
| Other shipping accident types | 0 | 0 | 0 | 0 | 0 | 0 | 0 | 0 | 0 | 0 | 0 |
| Accidents aboard ship | 38 | 45 | 48 | 57 | 62 | 42 | 42 | 44 | 37 | 30 | 39 |
| Persons fatally injured in accidents aboard ship | 6 | 2 | 7 | 8 | 8 | 4 | 2 | 5 | 8 | 3 | 3 |
| Boarding, being on board, falling overboard from the ship | 6 | 1 | 5 | 7 | 7 | 4 | 2 | 4 | 7 | 0 | 3 |
| In contact with any part of the ship or its contents | 0 | 1 | 2 | 1 | 1 | 0 | 0 | 1 | 1 | 3 | 0 |
| Persons seriously injured in accidents aboard ship | 33 | 44 | 42 | 53 | 47 | 39 | 36 | 34 | 32 | 30 | 37 |
| Boarding, being on board, falling overboard from the ship | 7 | 6 | 7 | 7 | 2 | 7 | 4 | 5 | 6 | 5 | 8 |
| In contact with any part of the ship or its contents | 26 | 38 | 35 | 46 | 45 | 32 | 32 | 29 | 26 | 25 | 29 |
Data extracted 30 March 2026 1 Fatalities include missing persons. | |||||||||||
| 2015 | 2016 | 2017 | 2018 | 2019 | 2020 | 2021 | 2022 | 2023 | 2024 | 2025 | |
|---|---|---|---|---|---|---|---|---|---|---|---|
| Vessels in shipping accidents with fatalities1 or serious injuries | 7 | 5 | 8 | 12 | 9 | 7 | 9 | 7 | 9 | 11 | 6 |
| Barge/Tug | 0 | 0 | 0 | 1 | 0 | 0 | 1 | 0 | 1 | 0 | 0 |
| Cargo/Tanker | 0 | 0 | 1 | 1 | 0 | 0 | 1 | 0 | 0 | 0 | 0 |
| Ferry/Passenger | 2 | 2 | 2 | 1 | 0 | 2 | 0 | 2 | 1 | 4 | 3 |
| Fishing | 3 | 2 | 3 | 8 | 3 | 5 | 5 | 3 | 3 | 4 | 2 |
| Other | 2 | 1 | 2 | 1 | 6 | 0 | 2 | 2 | 4 | 3 | 1 |
| Persons fatally injured in shipping accidents | 13 | 6 | 4 | 14 | 9 | 14 | 9 | 4 | 10 | 9 | 3 |
| Barge/Tug | 0 | 0 | 0 | 0 | 0 | 0 | 2 | 0 | 0 | 0 | 0 |
| Cargo/Tanker | 0 | 0 | 0 | 0 | 0 | 0 | 0 | 0 | 0 | 0 | 0 |
| Ferry/Passenger | 6 | 0 | 2 | 1 | 0 | 0 | 0 | 0 | 0 | 0 | 0 |
| Fishing | 6 | 6 | 1 | 13 | 4 | 14 | 6 | 3 | 5 | 7 | 2 |
| Other | 1 | 0 | 1 | 0 | 5 | 0 | 1 | 1 | 5 | 2 | 1 |
| Persons seriously injured in shipping accidents | 12 | 5 | 7 | 8 | 10 | 2 | 9 | 7 | 7 | 8 | 8 |
| Barge/Tug | 0 | 0 | 0 | 1 | 0 | 0 | 1 | 0 | 1 | 0 | 0 |
| Cargo/Tanker | 0 | 0 | 1 | 5 | 0 | 0 | 4 | 0 | 0 | 0 | 0 |
| Ferry/Passenger | 2 | 4 | 2 | 0 | 0 | 2 | 0 | 5 | 1 | 5 | 5 |
| Fishing | 1 | 0 | 3 | 1 | 2 | 0 | 1 | 1 | 3 | 0 | 3 |
| Other | 9 | 1 | 1 | 1 | 8 | 0 | 3 | 1 | 2 | 3 | 0 |
| Vessels in accidents aboard ship with fatalities1 or serious injuries | 38 | 45 | 48 | 58 | 62 | 42 | 42 | 44 | 37 | 30 | 39 |
| Barge/Tug | 0 | 4 | 2 | 3 | 5 | 3 | 2 | 2 | 3 | 1 | 2 |
| Cargo/Tanker | 5 | 12 | 19 | 22 | 24 | 15 | 12 | 14 | 10 | 8 | 19 |
| Ferry/Passenger | 9 | 6 | 5 | 8 | 8 | 3 | 4 | 8 | 8 | 7 | 3 |
| Fishing | 23 | 19 | 16 | 21 | 23 | 14 | 23 | 15 | 11 | 14 | 10 |
| Other | 1 | 4 | 6 | 4 | 2 | 7 | 1 | 5 | 5 | 0 | 5 |
| Persons fatally injured in accidents aboard ship | 6 | 2 | 7 | 8 | 7 | 4 | 2 | 5 | 8 | 3 | 3 |
| Barge/Tug | 0 | 0 | 0 | 0 | 0 | 0 | 0 | 0 | 0 | 0 | 0 |
| Cargo/Tanker | 0 | 0 | 2 | 2 | 2 | 0 | 0 | 0 | 0 | 0 | 0 |
| Ferry/Passenger | 1 | 0 | 2 | 0 | 1 | 2 | 0 | 2 | 0 | 0 | 1 |
| Fishing | 5 | 1 | 2 | 4 | 4 | 2 | 2 | 2 | 3 | 3 | 1 |
| Other | 0 | 1 | 1 | 2 | 0 | 0 | 0 | 1 | 5 | 0 | 1 |
| Persons seriously injured in accidents aboard ship | 33 | 44 | 42 | 53 | 47 | 39 | 36 | 34 | 31 | 30 | 37 |
| Barge/Tug | 0 | 4 | 3 | 2 | 4 | 2 | 2 | 2 | 2 | 1 | 2 |
| Cargo/Tanker | 5 | 12 | 16 | 21 | 16 | 16 | 11 | 12 | 9 | 9 | 20 |
| Ferry/Passenger | 8 | 6 | 4 | 10 | 7 | 1 | 4 | 4 | 7 | 7 | 2 |
| Fishing | 19 | 19 | 14 | 17 | 19 | 12 | 19 | 12 | 9 | 13 | 9 |
| Other | 1 | 3 | 5 | 3 | 1 | 8 | 0 | 4 | 4 | 0 | 4 |
Data extracted 30 March 2026 1 Fatalities include missing persons. | |||||||||||
Definitions
The following definitions apply to marine transportation occurrences that are required to be reported pursuant to the Canadian Transportation Accident Investigation and Safety Board Act and the Transportation Safety Board Regulations.
Marine occurrence
- any accident or incident associated with the operation of a ship
- any situation or condition that the Board has reasonable grounds to believe could, if left unattended, induce an accident or incident described above.
Marine accident
An accident resulting directly from the operation of a ship other than a pleasure craft, where
Accident aboard ship
- a person is killed or sustains a serious injury as a result of
- boarding, being on board or falling overboard from the ship, or
- coming into direct contact with any part of the ship or its contents;
Shipping accident
- the ship
- sinks, founders or capsizes,
- is involved in a collision (includes strikings and contacts),
- sustains a fire or an explosion,
- goes aground, or
- sustains damage that affects its seaworthiness or renders it unfit for its purpose,
- is missing or abandoned.
Marine incident
- a person falls overboard from the ship, or
- the ship
- makes unforeseen contact with the bottom without going aground,
- fouls a utility cable or pipe, or an underwater pipeline,
- is involved in a risk of a collision,
- sustains a total failure of
- the navigation equipment if the failure poses a threat to the safety of any person, property or the environment,
- the main or auxiliary machinery, or
- the propulsion, steering, or deck machinery if the failure poses a threat to the safety of any person, property or the environment;
- all or part of the ship’s cargo shifts or falls overboard, or
- is anchored, grounded or beached to avoid an occurrence,
- a crew member whose duties are directly related to the safe operation of the ship is unable to perform their duties as a result of a physical incapacitation which poses a threat to the safety of persons, property or the environment;
- there is an accidental release on board or from the ship consisting of a quantity of dangerous goods or an emission of radiation that is greater than the quantity or emission levels specified in Part 8 of the Transportation of Dangerous Goods Regulations.
Serious injury
(a) a fracture of any bone, except simple fractures of fingers, toes or the nose;
(b) lacerations that cause severe hemorrhage or nerve, muscle or tendon damage;
(c) an injury to an internal organ;
(d) second or third degree burns, or any burns affecting more than 5% of the body surface;
(e) a verified exposure to infectious substances or injurious radiation; or
(f) an injury that is likely to require hospitalization.
Vessels covered
This report covers commercial vessels that include all vessels either registered or licensed to operate commercially. Pleasure craft occurrences are not normally included unless they also involved a commercial vessel.
Vessel categories
- Commercial Non-fishing Vessels: include cargo vessels, ferries, passenger vessels, tugs and barges.
- Commercial Fishing Vessels: include vessels involved in commercial fishing.
- Other Vessels: include research vessels, oil exploration, exploitation and support vessels, government vessels and pleasure craft.
Miscellaneous
Gross tonnage (GT)
A measure of vessel capacity, including the spaces within the hull, and enclosed spaces above deck available for cargo, stores, fuel, passengers and crew, with certain exclusions.
Movement
A vessel’s travel segment between ports or a length of 1 km or more within a port harbor, with at least one port being a domestic port.
TSB regional offices’ areas of responsibility
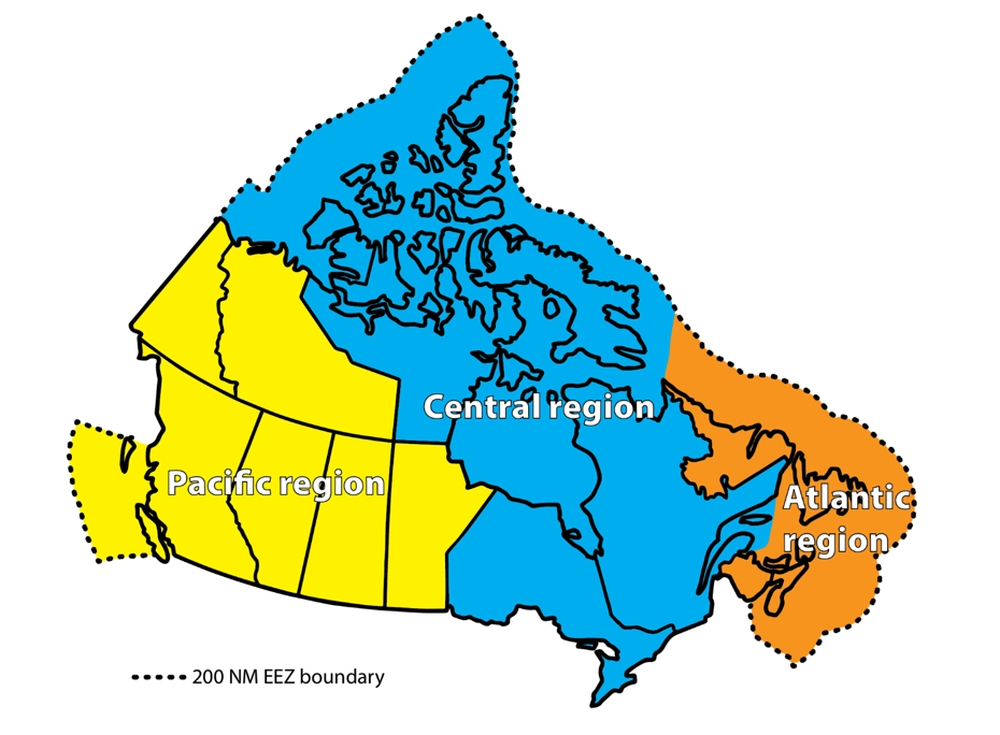
Pacific Region’s area of responsibility consists of the provinces of British Columbia, Alberta, Saskatchewan, and Manitoba, the Yukon and the Northwest Territories south of the 70th parallel, as well as the waters adjacent to these provinces and territories out to the Exclusive Economic Zone (EEZ) 200 NM boundary (or out to another State’s maritime boundary).
Central Region’s area of responsibility consists of the provinces of Ontario and Quebec (including the Magdalen Islands), the territory of Nunavut, and the Northwest Territories north of the 70th parallel, as well as James Bay, Hudson Bay, the St. Lawrence Seaway, and the Great Lakes waterways up to the Canada–U.S. border.
Atlantic Region’s area of responsibility consists of the provinces of New Brunswick, Nova Scotia, Prince Edward Island, and Newfoundland and Labrador, as well as the waters adjacent to these provinces out to the EEZ 200 NM boundary (or out to another State’s maritime boundary).