
Executive summary
The TSB received 1163 reports of rail transportation occurrences in 2025 (831 accidents and 332 incidents), including 71 fatalities.
The 831 accidents represent a 7% decrease from 2024 and a 17% decrease from the 10-year average of 1007.
The 71 rail transportation-related fatalities reported in 2025 are up compared to 69 in 2024 and above the 10-year average of 64. Among the fatalities, 53 involved trespassers, compared to 56 in 2024 and the 10-year average of 44.
The number of crossing accident fatalities increased in 2025 (16) compared to 2024 (12) but is below the 10-year average of 17.
Among all rail transportation accidents, 82 involved dangerous goods. This is down from 86 accidents in 2024 and is lower than the 10-year average of 109. Three accidents in 2025 resulted in dangerous goods being released.
There were 332 rail transportation incidents reported to the TSB in 2025, a 10% increase from 2024 (303). Incidents involving movements that exceeded limits of authority accounted for 39% (129) of all rail transportation incidents in 2025 – 14 fewer than in 2024 and below the 10-year average of 137.
According to Transport Canada data, 2025 main-track (non-yard) rail activity increased by 1% from 2024. The main-track accident rate in 2025 was 2.5 accidents per million main-track train-miles, up from 2.4 in 2024 but below the 10-year average of 2.6.
Rail transportation occurrences in 2025
The TSB gathers and uses transportation occurrence data during the course of its investigations to analyze safety deficiencies and identify risks in the Canadian rail transportation system.
This statistical summary covers federally regulated railways only. Non-federally regulated data reported to the TSB are not included in this report.
This summary serves to describe the accident, incident, and injury countsSee the Definitions section. that are presented in the included tables. It provides limited discussion and some context but is not intended to be an in-depth analysis of the data. Averages and percentages in this summary have been rounded.
It should be noted that certain characteristics of the data constrain statistical analysis and identification of emerging trends. These include the small totals of accidents and incidents, the large variability in the data from year to year, and changes to regulations and definitions. The reader is cautioned to keep these limitations in mind when viewing this summary to avoid drawing conclusions that cannot be supported by statistical analysis.
The 2025 data were collected according to the reporting requirements described in the Transportation Safety Board Regulations in force during that calendar year.
The statistics presented here reflect the TSB Railway Occurrence Database System (RODS) data as of 12 March 2026. Since the occurrence data are constantly being updated in the live database, the statistics may change slightly over time.
Also, as many occurrences are limited to data gathering, information recorded on some occurrences may not have been verified.
Accidents
Overview of accidents and casualties
In 2025, 831 rail accidentsSee the Definitions section. were reported to the TSB (Figure 1 and Table 1), down from the 2024 total of 895, and 17% below the previous 10-year (2015 to 2024) average of 1007.
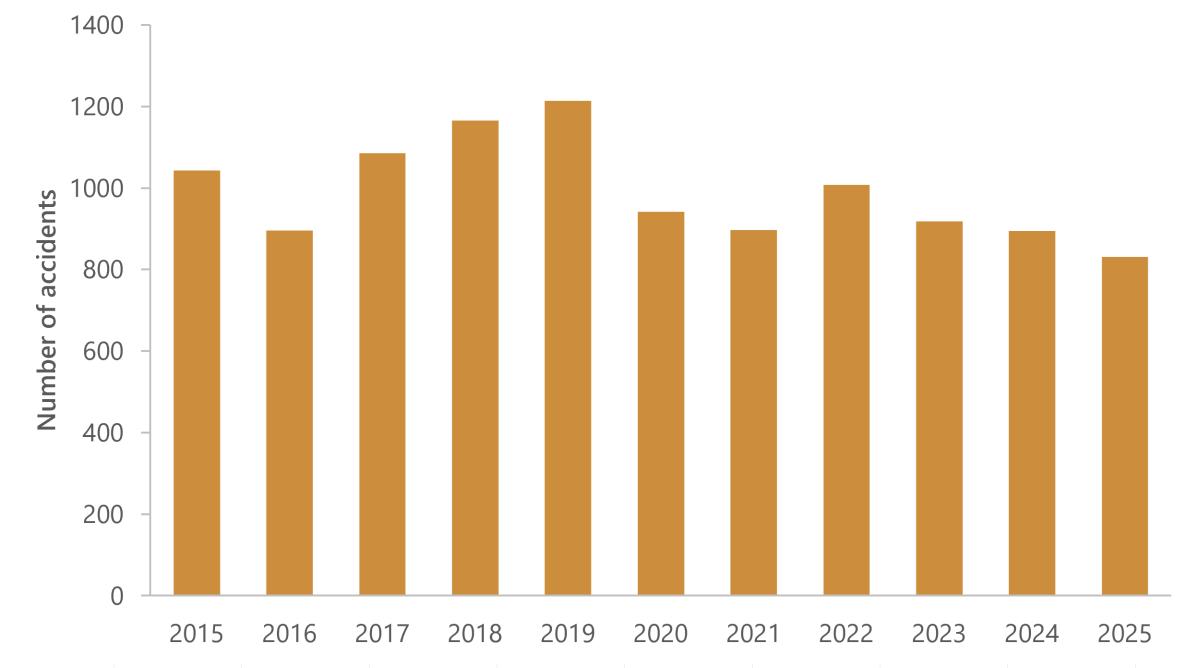
Figure 1. Data table
| Year | Number of accidents |
|---|---|
| 2015 | 1043 |
| 2016 | 896 |
| 2017 | 1086 |
| 2018 | 1166 |
| 2019 | 1214 |
| 2020 | 942 |
| 2021 | 897 |
| 2022 | 1008 |
| 2023 | 918 |
| 2024 | 895 |
| 2025 | 831 |
Freight trains accounted for 42% of all rolling stock involved in rail accidents in 2025. Six percent (50 in total) were passenger trains, with the remaining 52% comprising mainly single cars/cuts of cars, locomotives, and track units (Table 3).
The largest proportion of reported rail accidents comprised non-main-track derailments“Derailment” means any instance where one or more wheels of rolling stock have come off the normal running surface of the rail. (35%) (Figure 2 and Table 1). Typically, most non-main-track derailment accidents are minor, occurring during switching operations at speeds of less than 10 mph.
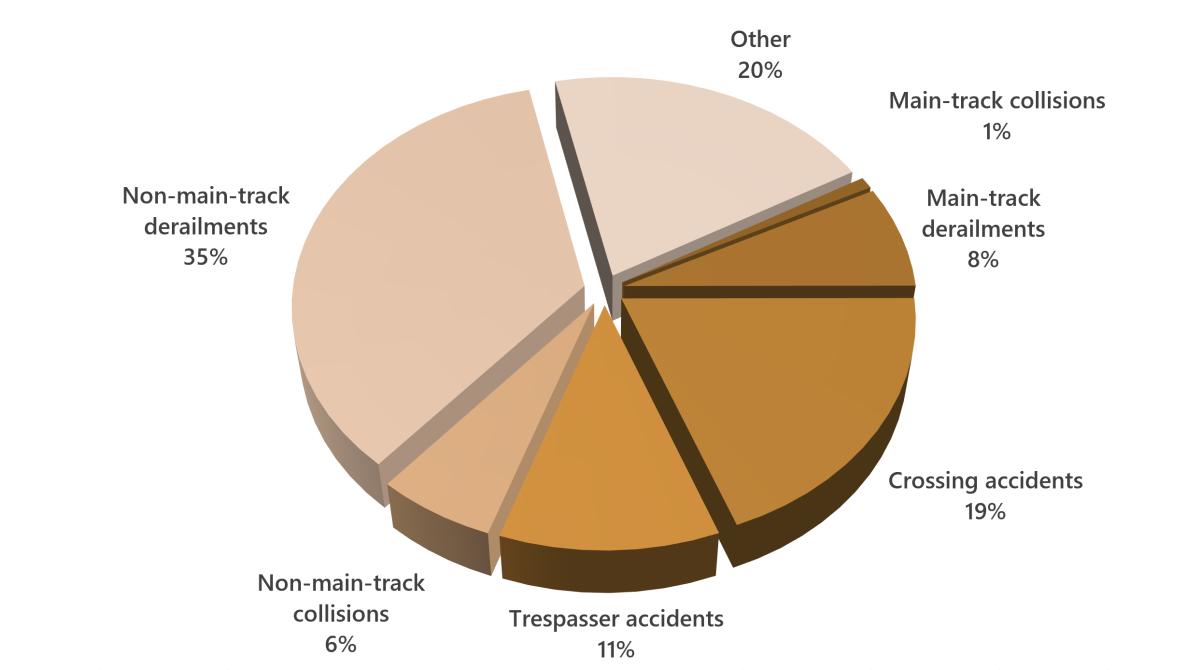
Figure 2. Data table
| Type of accident | Accidents |
|---|---|
| Main-track collisions | 7 |
| Main-track derailments | 62 |
| Crossing accidents | 160 |
| Trespasser accidents | 92 |
| Non-main-track collisions | 50 |
| Non-main-track derailments | 293 |
| Other | 167 |
* Due to rounding of percentages within categories, additions across accident types should be calculated from Table 1 data rather than by adding percentages shown in Figure 2.
The proportion of accidents that were main-track derailments in 2025 (7%) was up from the previous year (5%) and the same as the 10-year average (7%).
In 2025, 19% of rail accidents involved vehicles or pedestrians at rail crossings, above the 15% average of the previous 10 years.
In 2025, 82 accidents involved dangerous goods (Table 1),Accidents involving dangerous goods carried on rolling stock, as well as dangerous goods carried on road vehicles. down slightly from 2024 and below the 10-year average of 109. Three accidents resulted in a dangerous goods release in 2025, down from 6 in the previous year, and below the 10-year average of 5.
Rail fatalities (Figure 3 and Table 1) totalled 71 in 2025, up from 69 last year and above the 10-year average of 64. Crossing fatalities totalled 16 in 2025, up from 12 in 2024 but below the 10-year average of 17. TrespasserTrespasser accidents involve persons, primarily pedestrians, who are struck by rolling stock while they are on railway rights-of-way (other than railway crossings) that they are not authorized to occupy, resulting in death, serious injury or property damage. fatalities totalled 53 in 2025, down from 56 in the previous year but above the 10-year average of 44.
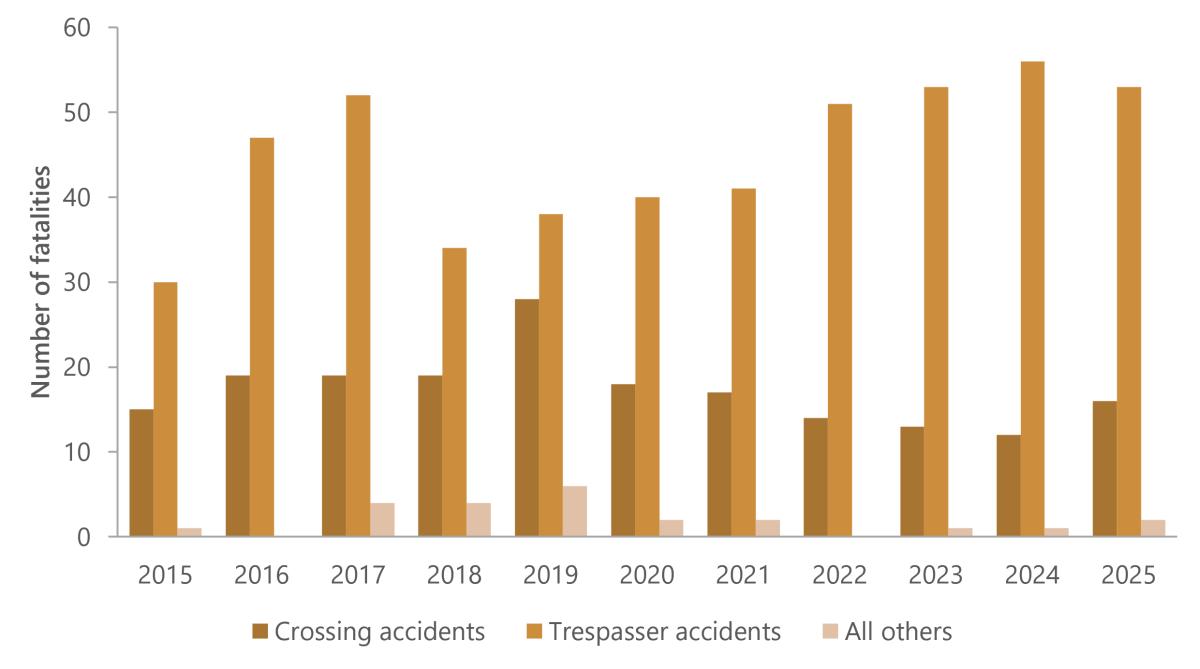
Figure 3. Data table
| Year | Crossing accidents | Trespasser accidents | All others |
|---|---|---|---|
| 2015 | 15 | 30 | 1 |
| 2016 | 19 | 47 | 0 |
| 2017 | 19 | 52 | 4 |
| 2018 | 19 | 34 | 4 |
| 2019 | 28 | 38 | 6 |
| 2020 | 18 | 40 | 2 |
| 2021 | 17 | 41 | 2 |
| 2022 | 14 | 51 | 0 |
| 2023 | 13 | 53 | 1 |
| 2024 | 12 | 56 | 1 |
| 2025 | 16 | 53 | 2 |
A total of 75 serious injuriesSee the Definitions section. resulted from rail occurrences in 2025 (Figure 4 and Table 1), up from 68 in 2024 and above the 10-year average of 59. Crossing accidentsA crossing accident occurs when railway rolling stock is involved in a grade-crossing collision with a motor vehicle or with a pedestrian, resulting in death, serious injury or property damage. resulted in 29 serious injuries, up from 24 in 2024 and above the 10-year average of 24. Serious injuries to trespassers totalled 31 in 2025, down from 35 last year but above the 10-year average of 21. Nine railway employees were seriously injured in 2025, up from 6 in 2024 but below the 10-year average of 11 (Table 2).
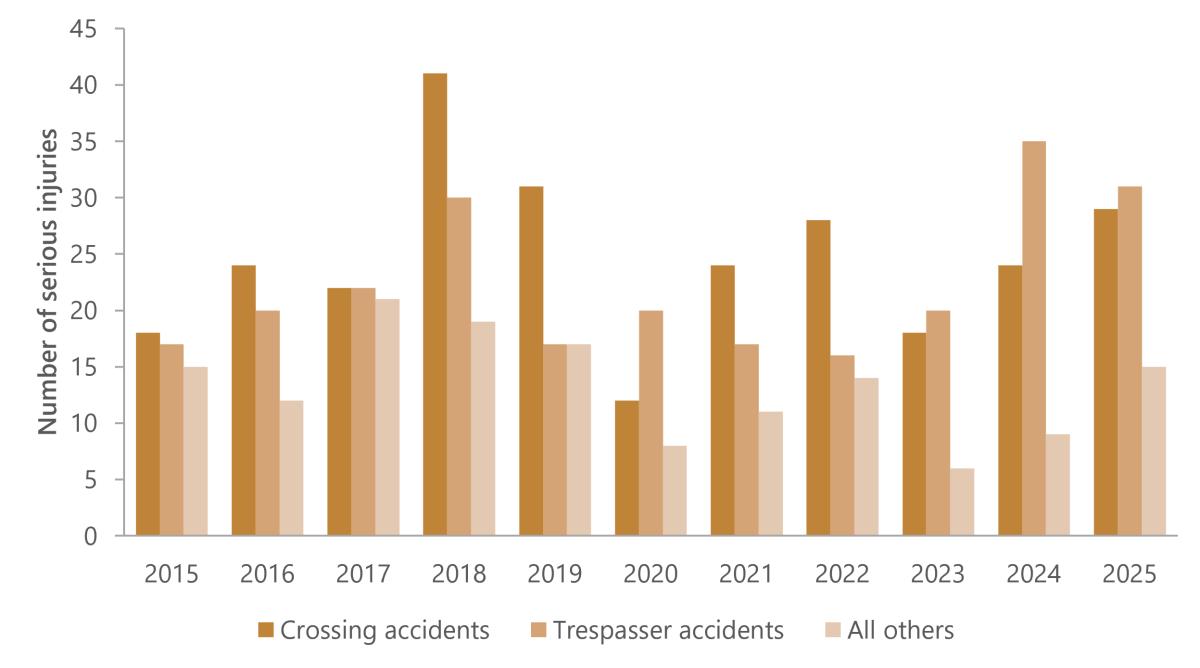
Figure 4. Data table
| Year | Crossing accidents | Trespasser accidents | All others |
|---|---|---|---|
| 2015 | 18 | 17 | 15 |
| 2016 | 24 | 20 | 12 |
| 2017 | 22 | 22 | 21 |
| 2018 | 41 | 30 | 19 |
| 2019 | 31 | 17 | 17 |
| 2020 | 12 | 20 | 8 |
| 2021 | 24 | 17 | 11 |
| 2022 | 28 | 16 | 14 |
| 2023 | 18 | 20 | 6 |
| 2024 | 24 | 35 | 9 |
| 2025 | 29 | 31 | 15 |
The number of main-track accidentsAccidents that occur on the main track or spurs (not including crossing accidents, trespasser accidents, and non-main-track collisions and derailments) are combined in order to match the figures used in the activity data, which is the total of main-track and spur (i.e., non-yard) million train miles. totalled 204 in 2025 (Figure 5 and Table 1), up from 199 in 2024 and above the 10-year average of 200. Rail activityTransport Canada, Rail Safety Directorate (email dated 13 March 2026). on main track (i.e., non-yard activity) increased by 1% from the previous year. The main-track accident rate in 2025 was 2.5 accidents per million main-track train miles, up from 2.4 in 2024 but below the 10-year average of 2.6.
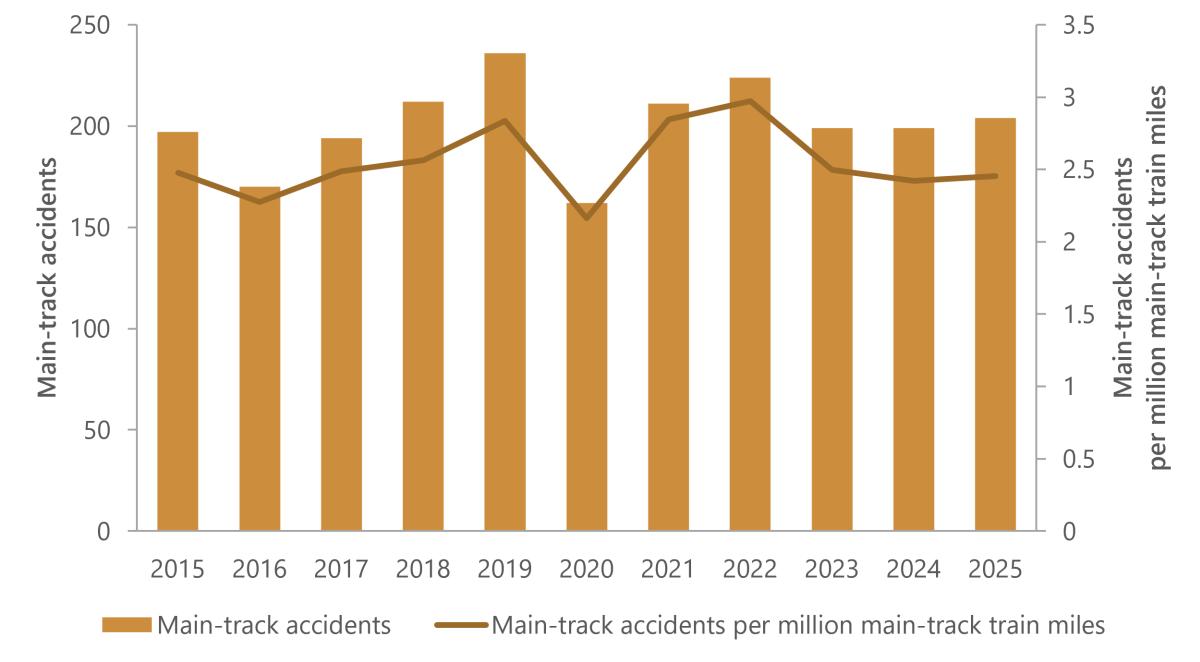
Figure 5. Data table
| Year | Main-track accidents | Main-track accidents per million main-track train miles |
|---|---|---|
| 2015 | 197 | 2.4764 |
| 2016 | 170 | 2.274623 |
| 2017 | 194 | 2.4872 |
| 2018 | 212 | 2.565316 |
| 2019 | 236 | 2.834716 |
| 2020 | 162 | 2.162082 |
| 2021 | 211 | 2.846715 |
| 2022 | 224 | 2.97239 |
| 2023 | 199 | 2.498054 |
| 2024 | 199 | 2.421951 |
| 2025 | 204 | 2.453532 |
Accidents by type
Main-track collisions and derailments are the most serious categories of rail accidents in terms of potential risk to the public and the environment (e.g., when passenger trains are involved or dangerous goods are released from trains that derail in populated areas).
There were 7 main-track collisions (Table 1 and Figure 6) in 2025, up from the 2024 total of 6 and above the 10-year average of 6. No fatalities or serious injuries resulted from main-track collisions in 2025. There was no release of dangerous goods as a result of main-track collisions in 2025 (data not presented).
A total of 62 main-track derailments (Table 4) were reported in 2025, an increase from the 2024 total of 48, but 12% below the 10-year average of 71 (Figure 6). Thirty-five percent of the 62 main-track derailments occurred in British Columbia, 21% occurred in Alberta and 16% occurred in Ontario.
The number of main-track derailments per million main-track (i.e., non-yard) train miles (Table 4) increased to 0.75 in 2025 from 0.58 the previous year but was below the 10-year average of 0.90.
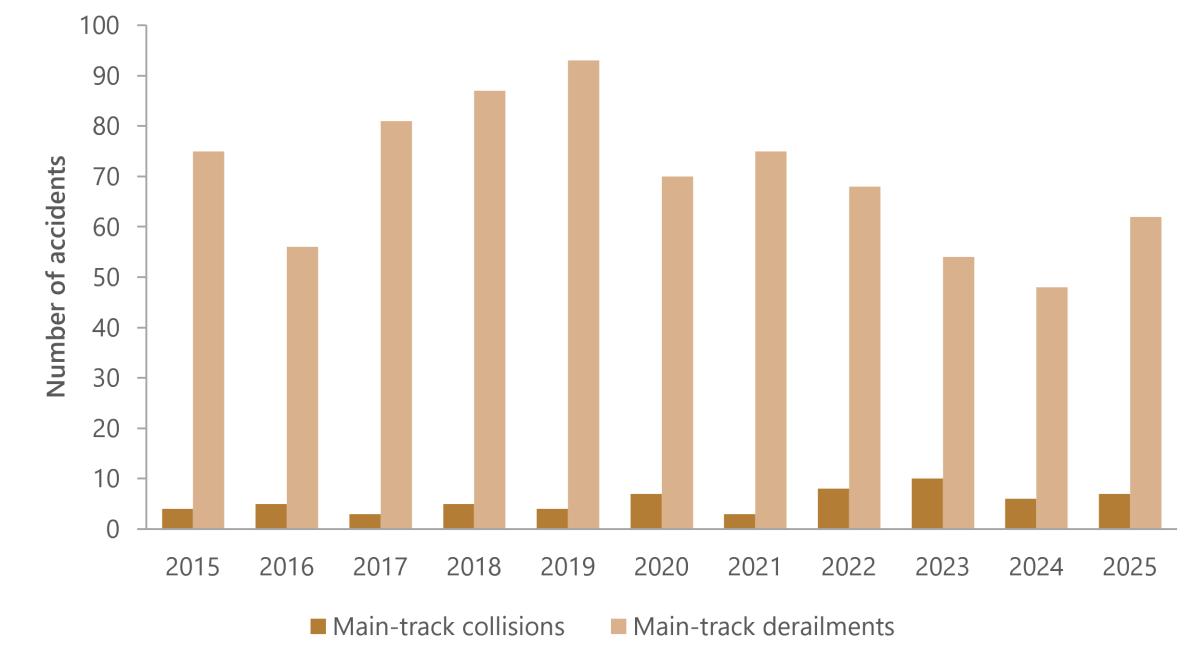
Figure 6. Data table
| Year | Main-track collisions | Main-track derailments |
|---|---|---|
| 2015 | 4 | 75 |
| 2016 | 5 | 56 |
| 2017 | 3 | 81 |
| 2018 | 5 | 87 |
| 2019 | 4 | 93 |
| 2020 | 7 | 70 |
| 2021 | 3 | 75 |
| 2022 | 8 | 68 |
| 2023 | 10 | 54 |
| 2024 | 6 | 48 |
| 2025 | 7 | 62 |
No fatalities or serious injuries resulted from main-track derailments in 2025 (Table 2). Ten main-track derailments involved dangerous goods, unchanged from 2024 and below the 10-year average of 12 (Table 1). Two of these derailments resulted in the release of dangerous goods (fuel-aviation turbine engine and liquefied petroleum gas) (data not presented).
Non-main-track collisions (Table 5 and Figure 7) totalled 50 in 2025, down from the 2024 total of 61, and below the 10-year average of 80. Derailments occurred in 26 non-main-track collisions (52%), and 15 of those collisions involved the derailment of a single car.
No fatalities or serious injuries resulted from non-main-track collisions in 2025 (Table 2). Dangerous goods were involved in 36% of non-main-track collisions, none of which resulted in a release of product (data not presented).
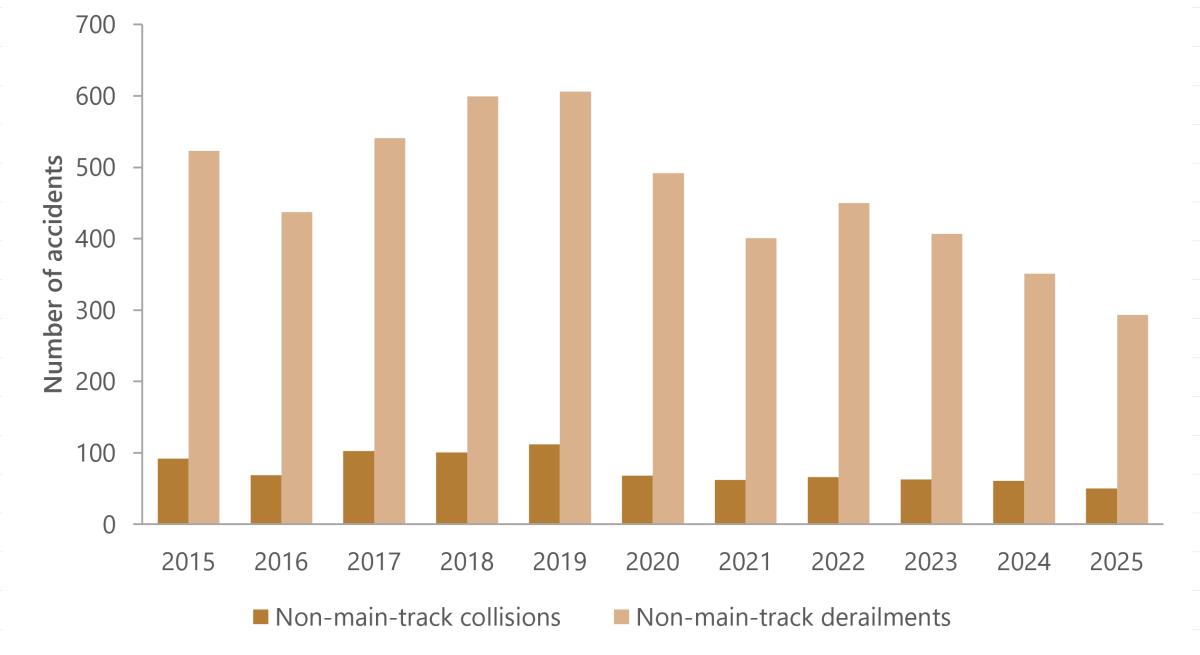
Figure 7. Data table
| Year | Non-main-track collisions | Non-main-track derailments |
|---|---|---|
| 2015 | 92 | 523 |
| 2016 | 69 | 437 |
| 2017 | 103 | 541 |
| 2018 | 101 | 599 |
| 2019 | 112 | 606 |
| 2020 | 68 | 492 |
| 2021 | 62 | 401 |
| 2022 | 66 | 450 |
| 2023 | 63 | 407 |
| 2024 | 61 | 351 |
| 2025 | 50 | 293 |
There were 293 non-main-track derailments in 2025 (Table 6 and Figure 7), down from 351 last year and 39% below the 10-year average of 481. In 78% of these accidents in 2025, 1 or 2 cars derailed. No fatalities or serious injuries resulted from non-main-track derailments in 2025 (Table 2).
Dangerous goods cars were involved in 16% of non-main-track derailments, none of which resulted in a release of product (data not presented).
Crossing accidents (tables 7 and 8) represented one of the more serious types of rail accidents in 2025, with 24% of these resulting in serious or fatal injuries (data not presented).
There were 160 crossing accidents in 2025, a 4% decrease from the 2024 total of 167 but above the 10-year average of 153. The number of accidents at public automated crossings (65) was down from the 2024 total of 67, and below the 10-year average of 72. The number of accidents at public passive crossings (57) was down 12% from the 2024 total of 65 but above the 10-year average of 50. Accidents at private and farm crossings (38) were up from the 2024 total of 35 and above the 10-year average of 30 (Table 7).
In 2025, 41% of crossing accidents occurred at public automated crossings, and 36% at public passive crossings (Table 7 and Figure 8).
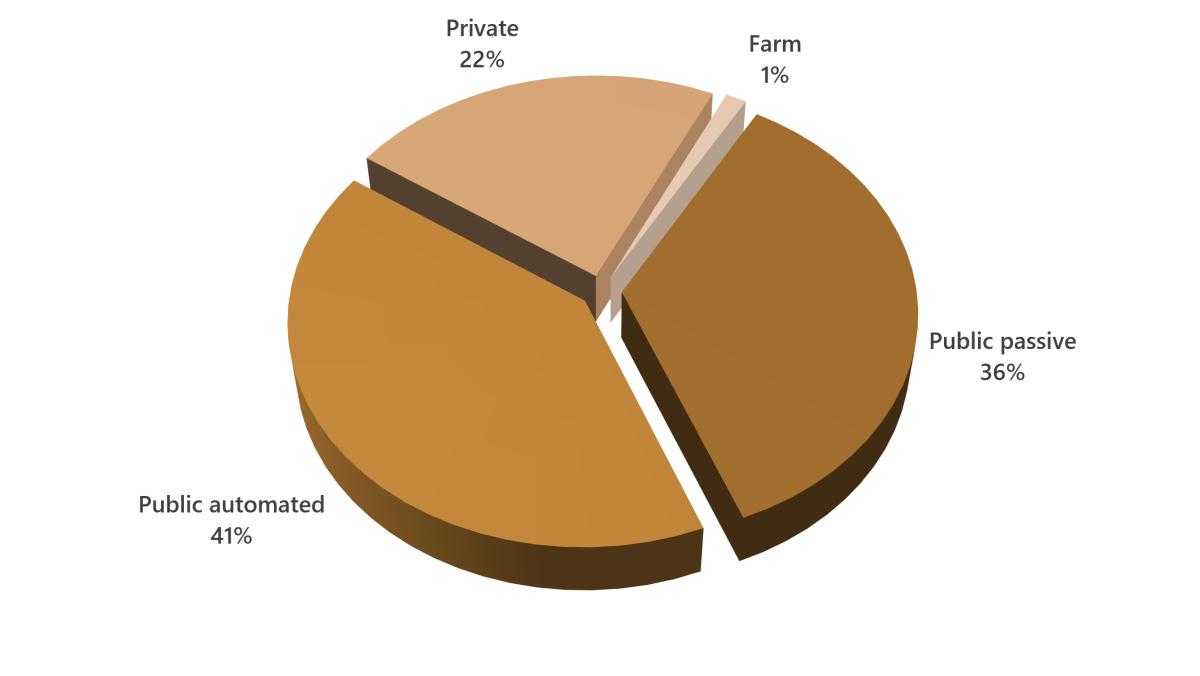
Figure 8. Data table
| Type de passage à niveau | Type of crossing | Accidents |
|---|---|---|
| Publics avec panneaux de signalisation | Public passive | 57 |
| Publics avec dispositifs automatiques | Public automated | 65 |
| Privés | Private | 36 |
| De ferme | Farm | 2 |
There were 16 fatal crossing accidents in 2025, up from 12 reported in 2024 but below the 10-year average of 17. Crossing-related fatalities totalled 16 in 2025, up from 12 reported in 2024 but below the 10-year average of 17 (Table 7).
Crossing accidents involving pedestrians accounted for 7% (11) of all crossing accidents in 2025, but accounted for 63% (10) of both fatal crossing accidents and crossing-related fatalities (data not presented).
Crossing-related serious injuries totalled 29 in 2025, up from the 2024 total of 24 and above the 10‑year average of 24 (Table 7).
In 2025, 3 crossing accidents resulted in a train derailment, up from 2 in 2024 but below the 10-year average (4) (Table 8).
One crossing accident resulted in the release of dangerous goods in 2025 (ethanol) (data not presented).
Alberta had the highest proportion (23%) of all crossing accidents in 2025. Ontario had the second highest proportion with 21% of crossing accidents, followed by Quebec with 18%, British Columbia with 16%, Manitoba with 11% and Saskatchewan with 8% (Table 8 and Figure 9).
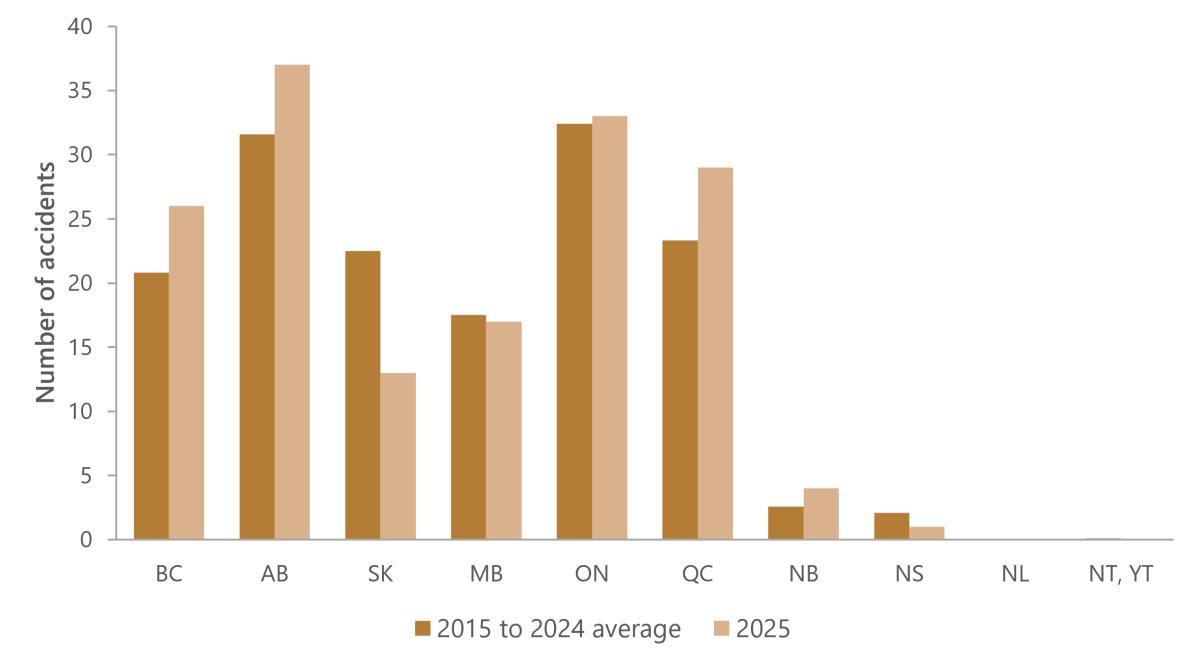
Figure 9. Data table
| Province or territory | 2015 to 2024 average | 2025 |
|---|---|---|
| BC | 20.8 | 26 |
| AB | 31.6 | 37 |
| SK | 22.5 | 13 |
| MB | 17.5 | 17 |
| ON | 32.4 | 33 |
| QC | 23.3 | 29 |
| NB | 2.6 | 4 |
| NS | 2.1 | 1 |
| NL | 0 | 0 |
| NT, YT | 0.1 | 0 |
Trespasser accidents (Table 9 and Figure 10) totalled 92 in 2025, down from 95 in 2024 but above the 10-year average of 69. Ontario accounted for 47% of trespasser accidents, followed by Alberta with 20%, British Columbia with 13%, Saskatchewan with 7% and Manitoba with 5%.
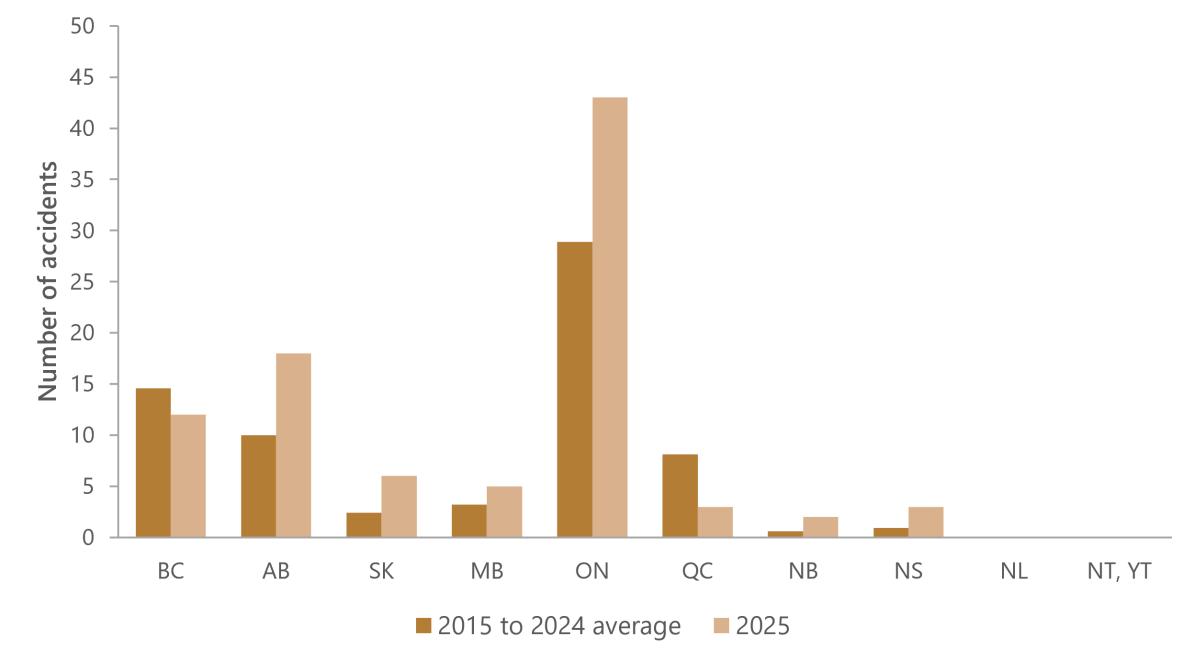
Figure 10. Data table
| Province or territory | 2015 to 2024 average | 2025 |
|---|---|---|
| BC | 14.6 | 12 |
| AB | 10 | 18 |
| SK | 2.4 | 6 |
| MB | 3.2 | 5 |
| ON | 28.9 | 43 |
| QC | 8.1 | 3 |
| NB | 0.6 | 2 |
| NS | 0.9 | 3 |
| NL | 0.1 | 0 |
| NT, YT | 0 | 0 |
In 2025, the percentage of trespasser accidents that were fatal (57%) was down from the 10-year average of 64%. The percentage of trespasser accidents resulting in serious injuries (34%) was above the 10-year average of 31%.
Incidents
Overview of incidents
In 2025, there were 332 reported rail incidentsSee the Definitions section. (Figure 11 and Table 1), up from 303 in 2024.
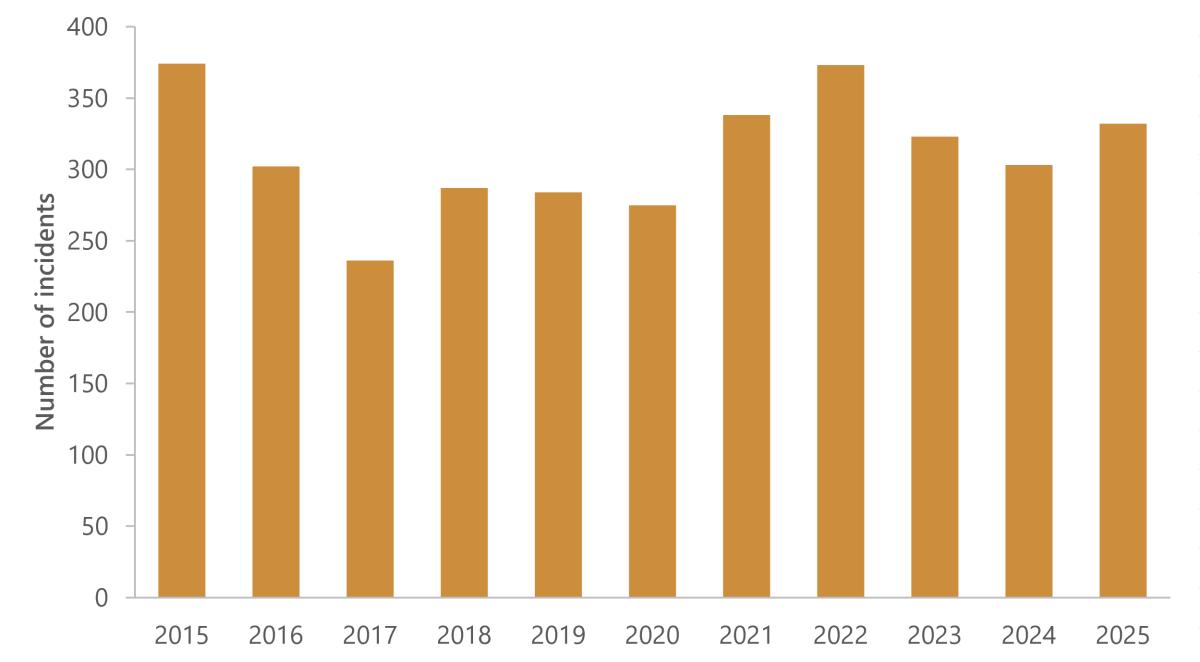
Figure 11. Data table
| Year | Number of incidents |
|---|---|
| 2015 | 374 |
| 2016 | 302 |
| 2017 | 236 |
| 2018 | 287 |
| 2019 | 284 |
| 2020 | 275 |
| 2021 | 338 |
| 2022 | 373 |
| 2023 | 323 |
| 2024 | 303 |
| 2025 | 332 |
The movement exceeds limits of authorityA movement exceeds limits of authority incident occurs when rolling stock occupies a main track or subdivision track, or track work takes place, in contravention of the rules or any regulations made under the Railway Safety Act. incident type accounted for 39% of reportable incidents in 2025 (Table 1), followed by non-main-track train derailments involving 1 or 2 cars (with no damage) at 34%, and fires on railway right-of-way (14%).
In 2025, there were 7 uncontrolled movement of rolling stock incidents, as well as 2 derailment incidents that involved an uncontrolled movement of rolling stock. In addition, 24 accidents involved an uncontrolled movement of rolling stock (Table 1), for a total of 33 occurrences (4 of which involved vandalism). This is down from the total of these occurrences in 2024 (43, four of which involved vandalism).
There were 129 movement exceeds limits of authority incidents in 2025, a decrease from 143 reported in 2024 and 6% below the 10-year average of 137 (Table 1).
Data tables
| 2015 | 2016 | 2017 | 2018 | 2019 | 2020 | 2021 | 2022 | 2023 | 2024 | 2025 | |
|---|---|---|---|---|---|---|---|---|---|---|---|
| Accidents | 1043 | 896 | 1086 | 1166 | 1214 | 942 | 897 | 1008 | 918 | 895 | 831 |
| Main-track collisions | 4 | 5 | 3 | 5 | 4 | 7 | 3 | 8 | 10 | 6 | 7 |
| Main-track derailments, 1 or 2 cars | 40 | 31 | 48 | 39 | 54 | 40 | 38 | 32 | 27 | 20 | 27 |
| Main-track derailments, 3 to 5 cars | 8 | 8 | 5 | 11 | 6 | 3 | 3 | 8 | 9 | 9 | 8 |
| Main-track derailments, 6 or more cars | 27 | 17 | 28 | 37 | 33 | 27 | 34 | 28 | 18 | 19 | 27 |
| Crossing accidents | 165 | 133 | 143 | 166 | 178 | 130 | 136 | 161 | 150 | 167 | 160 |
| Non-main-track collisions | 92 | 69 | 103 | 101 | 112 | 68 | 62 | 66 | 63 | 61 | 50 |
| Non-main-track derailments, 1 or 2 cars | 410 | 348 | 424 | 476 | 492 | 406 | 328 | 371 | 323 | 271 | 229 |
| Non-main-track derailments, 3 to 5 cars | 87 | 62 | 82 | 100 | 87 | 65 | 58 | 56 | 62 | 57 | 41 |
| Non-main-track derailments, 6 or more cars | 26 | 27 | 35 | 23 | 27 | 21 | 15 | 23 | 22 | 23 | 23 |
| Collisions/derailments involving track units | 43 | 23 | 45 | 48 | 50 | 39 | 50 | 65 | 50 | 54 | 41 |
| Employee/passenger accidents | 15 | 16 | 17 | 13 | 15 | 8 | 11 | 10 | 4 | 5 | 14 |
| Trespasser accidents | 50 | 68 | 76 | 68 | 56 | 60 | 63 | 72 | 80 | 95 | 92 |
| Fires/explosions on board rolling stock | 30 | 34 | 32 | 33 | 58 | 33 | 45 | 46 | 42 | 53 | 46 |
| Other accident types | 46 | 55 | 45 | 46 | 42 | 35 | 51 | 62 | 58 | 55 | 66 |
| Reportable incidents | 374 | 302 | 236 | 287 | 284 | 275 | 338 | 373 | 323 | 303 | 332 |
| Main-track derailments, 1 or 2 cars (no damage) | 3 | 5 | 3 | 4 | 3 | 1 | 2 | 1 | 0 | 2 | 2 |
| Non-main-track collisions (no derailment, no damage) | 4 | 4 | 2 | 2 | 0 | 1 | 2 | 4 | 3 | 0 | 1 |
| Non-main-track derailments, 1 or 2 cars (no damage) | 125 | 97 | 67 | 96 | 58 | 32 | 39 | 111 | 67 | 69 | 112 |
| Fires on railway right-of-way | 2 | 1 | 1 | 1 | 42 | 46 | 145 | 88 | 56 | 46 | 48 |
| Main-track switch in abnormal position | 12 | 7 | 12 | 7 | 15 | 3 | 13 | 8 | 8 | 6 | 2 |
| Movement exceeds limits of authority | 142 | 133 | 122 | 138 | 136 | 149 | 109 | 133 | 162 | 143 | 129 |
| Uncontrolled movement of rolling stock | 14 | 10 | 14 | 15 | 15 | 19 | 13 | 9 | 9 | 8 | 7 |
| Other reportable incidents | 72 | 45 | 15 | 24 | 15 | 24 | 15 | 19 | 18 | 29 | 31 |
| Main-track accidents2 | 197 | 170 | 194 | 212 | 236 | 162 | 211 | 224 | 199 | 199 | 204 |
| Million main-track train miles3 | 79.6 | 74.7 | 78.0 | 82.6 | 83.3 | 74.9 | 74.1 | 75.4 | 79.7 | 82.2 | 83.1 |
| Main-track accidents per million main-track train miles | 2.5 | 2.3 | 2.5 | 2.6 | 2.8 | 2.2 | 2.8 | 3.0 | 2.5 | 2.4 | 2.5 |
| Accidents involving dangerous goods | 127 | 101 | 116 | 125 | 171 | 82 | 86 | 110 | 87 | 86 | 82 |
| Main-track derailments | 12 | 8 | 10 | 17 | 19 | 7 | 16 | 11 | 10 | 10 | 10 |
| Crossing accidents | 4 | 4 | 6 | 7 | 7 | 3 | 2 | 5 | 4 | 3 | 6 |
| Non-main-track collisions | 32 | 19 | 39 | 33 | 44 | 13 | 19 | 30 | 21 | 24 | 18 |
| Non-main-track derailments | 75 | 62 | 55 | 62 | 95 | 56 | 45 | 60 | 47 | 47 | 46 |
| Other accident types | 4 | 8 | 6 | 6 | 6 | 3 | 4 | 4 | 5 | 2 | 2 |
| Accidents with a dangerous goods release | 7 | 3 | 5 | 6 | 9 | 3 | 2 | 2 | 7 | 6 | 3 |
| Accidents involving an uncontrolled movement of rolling stock | 41 | 33 | 48 | 47 | 63 | 28 | 33 | 37 | 27 | 31 | 24 |
| Persons fatally injured in reportable occurrences | 46 | 66 | 75 | 57 | 72 | 60 | 60 | 65 | 67 | 69 | 71 |
| Crossing accidents | 15 | 19 | 19 | 19 | 28 | 18 | 17 | 14 | 13 | 12 | 16 |
| Trespasser accidents | 30 | 47 | 52 | 34 | 38 | 40 | 41 | 51 | 53 | 56 | 53 |
| Other occurrence types4 | 1 | 0 | 4 | 4 | 6 | 2 | 2 | 0 | 1 | 1 | 2 |
| Persons seriously injured in reportable occurrences | 50 | 56 | 65 | 90 | 65 | 40 | 52 | 58 | 44 | 68 | 75 |
| Crossing accidents | 18 | 24 | 22 | 41 | 31 | 12 | 24 | 28 | 18 | 24 | 29 |
| Trespasser accidents | 17 | 20 | 22 | 30 | 17 | 20 | 17 | 16 | 20 | 35 | 31 |
| Other occurrence types4 | 15 | 12 | 21 | 19 | 17 | 8 | 11 | 14 | 6 | 9 | 15 |
Data extracted 12 March 2026 1 Data are for federally regulated railways and include only those occurrences that are reportable under the TSB Regulations. | |||||||||||
| 2015 | 2016 | 2017 | 2018 | 2019 | 2020 | 2021 | 2022 | 2023 | 2024 | 2025 | |
|---|---|---|---|---|---|---|---|---|---|---|---|
| Persons fatally injured in reportable occurrences | 46 | 66 | 75 | 57 | 72 | 60 | 60 | 65 | 67 | 69 | 71 |
| Main-track collisions | 0 | 0 | 0 | 0 | 0 | 0 | 0 | 0 | 0 | 0 | 0 |
| Main-track derailments | 0 | 0 | 0 | 1 | 3 | 0 | 0 | 0 | 0 | 0 | 0 |
| Crossing accidents | 15 | 19 | 19 | 19 | 28 | 18 | 17 | 14 | 13 | 12 | 16 |
| Non-main-track collisions | 0 | 0 | 0 | 2 | 0 | 1 | 0 | 0 | 0 | 0 | 0 |
| Non-main-track derailments | 0 | 0 | 0 | 0 | 0 | 0 | 0 | 0 | 0 | 0 | 0 |
| Collisions/derailments involving track units | 0 | 0 | 0 | 0 | 0 | 0 | 0 | 0 | 0 | 0 | 0 |
| Employee/passenger accidents | 1 | 0 | 3 | 1 | 2 | 1 | 2 | 0 | 1 | 0 | 0 |
| Trespasser accidents | 30 | 47 | 52 | 34 | 38 | 40 | 41 | 51 | 53 | 56 | 53 |
| Other accident types | 0 | 0 | 0 | 0 | 1 | 0 | 0 | 0 | 0 | 0 | 2 |
| Reportable incidents | 0 | 0 | 1 | 0 | 0 | 0 | 0 | 0 | 0 | 1 | 0 |
| Persons seriously injured in reportable occurrences | 50 | 56 | 65 | 90 | 65 | 40 | 52 | 58 | 44 | 68 | 75 |
| Main-track collisions | 0 | 0 | 0 | 0 | 0 | 0 | 0 | 0 | 0 | 1 | 0 |
| Main-track derailments | 0 | 0 | 0 | 3 | 1 | 0 | 0 | 0 | 0 | 0 | 0 |
| Crossing accidents | 18 | 24 | 22 | 41 | 31 | 12 | 24 | 28 | 18 | 24 | 29 |
| Non-main-track collisions | 0 | 0 | 2 | 0 | 2 | 0 | 0 | 1 | 1 | 0 | 0 |
| Non-main-track derailments | 0 | 0 | 0 | 0 | 0 | 0 | 0 | 0 | 0 | 0 | 0 |
| Collisions/derailments involving track units | 0 | 3 | 0 | 0 | 2 | 1 | 1 | 1 | 0 | 1 | 0 |
| Employee/passenger accidents | 11 | 8 | 16 | 12 | 11 | 6 | 8 | 10 | 3 | 5 | 14 |
| Trespasser accidents | 17 | 20 | 22 | 30 | 17 | 20 | 17 | 16 | 20 | 35 | 31 |
| Other accident types | 2 | 1 | 3 | 0 | 1 | 0 | 2 | 2 | 2 | 2 | 1 |
| Reportable incidents | 2 | 0 | 0 | 4 | 0 | 1 | 0 | 0 | 0 | 0 | 0 |
| Persons fatally injured | 46 | 66 | 75 | 57 | 72 | 60 | 60 | 65 | 67 | 69 | 71 |
| Employees | 1 | 0 | 3 | 4 | 5 | 2 | 1 | 0 | 1 | 1 | 0 |
| Passengers | 0 | 0 | 1 | 0 | 0 | 0 | 1 | 0 | 0 | 0 | 0 |
| Pedestrians | 3 | 7 | 8 | 9 | 13 | 7 | 5 | 5 | 5 | 4 | 6 |
| Vehicle occupants | 11 | 12 | 11 | 10 | 16 | 14 | 10 | 9 | 8 | 9 | 8 |
| Trespassers | 31 | 47 | 52 | 34 | 38 | 36 | 43 | 51 | 53 | 55 | 57 |
| Other categories of persons | 0 | 0 | 0 | 0 | 0 | 1 | 0 | 0 | 0 | 0 | 0 |
| Persons seriously injured | 50 | 56 | 65 | 90 | 65 | 40 | 52 | 58 | 44 | 68 | 75 |
| Employees | 8 | 15 | 19 | 17 | 16 | 8 | 7 | 10 | 3 | 6 | 9 |
| Passengers | 8 | 2 | 3 | 3 | 1 | 0 | 2 | 2 | 1 | 1 | 5 |
| Pedestrians | 2 | 0 | 2 | 8 | 6 | 3 | 8 | 6 | 6 | 6 | 1 |
| Vehicle occupants | 16 | 18 | 18 | 32 | 25 | 9 | 20 | 24 | 13 | 22 | 29 |
| Trespassers | 16 | 21 | 23 | 30 | 17 | 20 | 15 | 16 | 21 | 33 | 31 |
| Other categories of persons | 0 | 0 | 0 | 0 | 0 | 0 | 0 | 0 | 0 | 0 | 0 |
Data extracted 12 March 2026 1 Data are for federally regulated railways and include only those occurrences that are reportable under the TSB Regulations. | |||||||||||
| 2015 | 2016 | 2017 | 2018 | 2019 | 2020 | 2021 | 2022 | 2023 | 2024 | 2025 | |
|---|---|---|---|---|---|---|---|---|---|---|---|
| Freight trains | 412 | 338 | 402 | 389 | 418 | 327 | 328 | 340 | 351 | 388 | 379 |
| Main-track collisions | 6 | 6 | 6 | 5 | 4 | 8 | 6 | 13 | 13 | 11 | 11 |
| Main-track derailments | 66 | 48 | 75 | 75 | 78 | 64 | 66 | 57 | 45 | 41 | 52 |
| Non-main-track collisions | 27 | 11 | 28 | 20 | 26 | 15 | 12 | 7 | 8 | 22 | 9 |
| Non-main-track derailments | 108 | 88 | 95 | 96 | 78 | 56 | 36 | 31 | 52 | 46 | 52 |
| Crossing accidents | 117 | 86 | 94 | 106 | 117 | 94 | 90 | 117 | 106 | 127 | 103 |
| Trespasser accidents | 36 | 48 | 51 | 40 | 42 | 49 | 51 | 51 | 62 | 73 | 69 |
| Other accident types | 52 | 51 | 53 | 47 | 73 | 41 | 67 | 64 | 65 | 68 | 83 |
| Passenger trains | 46 | 56 | 54 | 67 | 47 | 40 | 42 | 53 | 38 | 43 | 50 |
| Main-track collisions | 0 | 0 | 0 | 1 | 1 | 1 | 0 | 0 | 1 | 0 | 0 |
| Main-track derailments | 2 | 4 | 2 | 2 | 2 | 1 | 3 | 0 | 0 | 1 | 1 |
| Non-main-track collisions | 0 | 0 | 0 | 0 | 0 | 5 | 0 | 1 | 2 | 3 | 0 |
| Non-main-track derailments | 2 | 1 | 4 | 6 | 3 | 13 | 3 | 2 | 1 | 1 | 2 |
| Crossing accidents | 16 | 11 | 13 | 18 | 15 | 7 | 12 | 9 | 10 | 7 | 14 |
| Trespasser accidents | 10 | 13 | 22 | 24 | 12 | 4 | 10 | 17 | 16 | 15 | 14 |
| Other accident types | 16 | 27 | 13 | 16 | 14 | 9 | 14 | 24 | 8 | 16 | 19 |
| Track units | 77 | 41 | 71 | 81 | 81 | 63 | 91 | 100 | 86 | 101 | 76 |
| Main-track collisions | 0 | 0 | 0 | 0 | 0 | 0 | 0 | 0 | 0 | 0 | 0 |
| Main-track derailments | 0 | 0 | 0 | 0 | 0 | 0 | 0 | 0 | 0 | 0 | 0 |
| Non-main-track collisions | 0 | 0 | 0 | 0 | 0 | 0 | 0 | 0 | 0 | 0 | 0 |
| Non-main-track derailments | 0 | 0 | 0 | 0 | 0 | 0 | 0 | 0 | 0 | 0 | 0 |
| Crossing accidents | 5 | 4 | 5 | 6 | 4 | 3 | 7 | 9 | 8 | 7 | 7 |
| Trespasser accidents | 0 | 0 | 0 | 0 | 0 | 0 | 0 | 0 | 0 | 0 | 0 |
| Other accident types | 72 | 37 | 66 | 75 | 77 | 60 | 84 | 91 | 78 | 94 | 69 |
| Single car/cut of cars | 476 | 416 | 526 | 594 | 616 | 468 | 412 | 482 | 411 | 351 | 309 |
| Main-track collisions | 0 | 1 | 0 | 2 | 2 | 3 | 1 | 1 | 3 | 0 | 0 |
| Main-track derailments | 2 | 2 | 2 | 7 | 5 | 4 | 2 | 5 | 4 | 4 | 3 |
| Non-main-track collisions | 103 | 93 | 119 | 133 | 141 | 83 | 82 | 89 | 80 | 69 | 67 |
| Non-main-track derailments | 333 | 280 | 362 | 402 | 415 | 339 | 295 | 349 | 286 | 241 | 197 |
| Crossing accidents | 17 | 17 | 21 | 26 | 25 | 13 | 15 | 10 | 17 | 16 | 19 |
| Trespasser accidents | 4 | 6 | 1 | 3 | 2 | 2 | 1 | 0 | 1 | 3 | 4 |
| Other accident types | 17 | 17 | 21 | 21 | 26 | 24 | 16 | 28 | 20 | 18 | 19 |
| Other types of train/rolling stock | 132 | 126 | 117 | 151 | 165 | 126 | 104 | 122 | 102 | 100 | 90 |
| Main-track collisions | 0 | 2 | 0 | 0 | 1 | 1 | 0 | 1 | 1 | 0 | 2 |
| Main-track derailments | 5 | 2 | 2 | 3 | 8 | 1 | 4 | 7 | 5 | 2 | 6 |
| Non-main-track collisions | 15 | 21 | 14 | 18 | 18 | 10 | 8 | 15 | 10 | 9 | 7 |
| Non-main-track derailments | 92 | 72 | 82 | 103 | 113 | 88 | 69 | 68 | 69 | 65 | 43 |
| Crossing accidents | 10 | 15 | 10 | 12 | 17 | 13 | 13 | 16 | 9 | 10 | 17 |
| Trespasser accidents | 0 | 1 | 2 | 1 | 0 | 5 | 1 | 4 | 1 | 4 | 5 |
| Other accident types | 10 | 13 | 7 | 14 | 8 | 8 | 9 | 11 | 7 | 10 | 10 |
Data extracted 12 March 2026 1 Data are for federally regulated railways and include only those occurrences that are reportable under the TSB Regulations. | |||||||||||
| 2015 | 2016 | 2017 | 2018 | 2019 | 2020 | 2021 | 2022 | 2023 | 2024 | 2025 | |
|---|---|---|---|---|---|---|---|---|---|---|---|
| Main-track derailments | 75 | 56 | 81 | 87 | 93 | 70 | 75 | 68 | 54 | 48 | 62 |
| Newfoundland and Labrador | 0 | 0 | 2 | 0 | 0 | 1 | 2 | 2 | 1 | 1 | 0 |
| Nova Scotia | 0 | 1 | 0 | 0 | 0 | 0 | 0 | 1 | 0 | 0 | 0 |
| New Brunswick | 2 | 1 | 0 | 0 | 1 | 0 | 3 | 1 | 1 | 1 | 0 |
| Quebec | 9 | 6 | 6 | 9 | 10 | 9 | 3 | 10 | 4 | 5 | 6 |
| Ontario | 21 | 13 | 11 | 14 | 17 | 14 | 13 | 9 | 8 | 10 | 10 |
| Manitoba | 4 | 4 | 6 | 8 | 14 | 8 | 5 | 5 | 6 | 7 | 3 |
| Saskatchewan | 8 | 6 | 14 | 18 | 12 | 6 | 9 | 12 | 9 | 4 | 8 |
| Alberta | 17 | 13 | 21 | 20 | 17 | 11 | 17 | 10 | 8 | 11 | 13 |
| British Columbia | 14 | 12 | 21 | 18 | 22 | 21 | 23 | 18 | 17 | 9 | 22 |
| Northwest Territories and Yukon | 0 | 0 | 0 | 0 | 0 | 0 | 0 | 0 | 0 | 0 | 0 |
| Main-track derailments per million main-track train miles2 | 0.94 | 0.75 | 1.04 | 1.05 | 1.12 | 0.93 | 1.01 | 0.90 | 0.68 | 0.58 | 0.75 |
| Main-track derailments per billion gross ton miles3 | 0.14 | 0.11 | 0.14 | 0.15 | 0.16 | 0.12 | 0.13 | 0.12 | 0.10 | 0.08 | n/a |
| Main-track derailments by number of derailed cars | 75 | 56 | 81 | 87 | 93 | 70 | 75 | 68 | 54 | 48 | 62 |
| 1 car | 30 | 25 | 39 | 29 | 43 | 32 | 32 | 26 | 20 | 16 | 21 |
| 2 cars | 10 | 6 | 9 | 10 | 11 | 8 | 6 | 6 | 7 | 4 | 6 |
| 3 cars | 4 | 2 | 2 | 4 | 2 | 2 | 1 | 1 | 3 | 3 | 5 |
| 4 cars | 2 | 2 | 2 | 4 | 3 | 1 | 1 | 4 | 2 | 5 | 1 |
| 5 to 10 cars | 16 | 10 | 13 | 21 | 11 | 10 | 10 | 17 | 8 | 8 | 14 |
| 11 cars or more | 13 | 11 | 16 | 19 | 23 | 17 | 25 | 14 | 14 | 12 | 15 |
Data extracted 12 March 2026 1 Data are for federally regulated railways and include only those occurrences that are reportable under the TSB Regulations. | |||||||||||
| 2015 | 2016 | 2017 | 2018 | 2019 | 2020 | 2021 | 2022 | 2023 | 2024 | 2025 | |
|---|---|---|---|---|---|---|---|---|---|---|---|
| Non-main-track collisions | 92 | 69 | 103 | 101 | 112 | 68 | 62 | 66 | 63 | 61 | 50 |
| Newfoundland and Labrador | 0 | 0 | 0 | 1 | 0 | 0 | 0 | 0 | 0 | 0 | 0 |
| Nova Scotia | 0 | 0 | 1 | 0 | 0 | 1 | 0 | 1 | 2 | 0 | 0 |
| New Brunswick | 0 | 1 | 1 | 2 | 0 | 2 | 1 | 0 | 1 | 0 | 2 |
| Quebec | 10 | 7 | 9 | 5 | 9 | 4 | 3 | 5 | 6 | 7 | 7 |
| Ontario | 20 | 19 | 25 | 19 | 26 | 15 | 9 | 24 | 19 | 11 | 18 |
| Manitoba | 15 | 10 | 14 | 8 | 15 | 11 | 8 | 10 | 9 | 5 | 2 |
| Saskatchewan | 8 | 5 | 7 | 13 | 11 | 5 | 4 | 2 | 1 | 8 | 6 |
| Alberta | 17 | 19 | 23 | 26 | 29 | 13 | 16 | 12 | 11 | 18 | 6 |
| British Columbia | 21 | 8 | 23 | 27 | 22 | 17 | 21 | 12 | 14 | 12 | 9 |
| Northwest Territories and Yukon | 1 | 0 | 0 | 0 | 0 | 0 | 0 | 0 | 0 | 0 | 0 |
| Non-main-track collisions | 92 | 69 | 103 | 101 | 112 | 68 | 62 | 66 | 63 | 61 | 50 |
| No cars derailed | 63 | 38 | 64 | 54 | 63 | 34 | 34 | 35 | 34 | 30 | 24 |
| 1 car | 21 | 14 | 16 | 27 | 27 | 17 | 12 | 13 | 15 | 11 | 15 |
| 2 cars | 1 | 7 | 11 | 6 | 11 | 4 | 6 | 9 | 9 | 8 | 6 |
| 3 cars | 3 | 4 | 5 | 4 | 6 | 6 | 3 | 2 | 1 | 4 | 4 |
| 4 cars | 2 | 2 | 3 | 2 | 0 | 2 | 2 | 1 | 1 | 0 | 1 |
| 5 to 10 cars | 2 | 3 | 4 | 7 | 3 | 5 | 4 | 6 | 3 | 6 | 0 |
| 11 cars or more | 0 | 1 | 0 | 1 | 2 | 0 | 1 | 0 | 0 | 2 | 0 |
Data extracted 12 March 2026 1 Data are for federally regulated railways and include only those occurrences that are reportable under the TSB Regulations. | |||||||||||
| 2015 | 2016 | 2017 | 2018 | 2019 | 2020 | 2021 | 2022 | 2023 | 2024 | 2025 | |
|---|---|---|---|---|---|---|---|---|---|---|---|
| Non-main-track derailment accidents | 523 | 437 | 541 | 599 | 606 | 492 | 401 | 450 | 407 | 351 | 293 |
| Newfoundland and Labrador | 6 | 12 | 11 | 9 | 7 | 7 | 10 | 6 | 10 | 5 | 7 |
| Nova Scotia | 3 | 2 | 5 | 6 | 3 | 8 | 6 | 7 | 6 | 1 | 1 |
| New Brunswick | 13 | 9 | 9 | 5 | 12 | 7 | 6 | 11 | 7 | 5 | 8 |
| Quebec | 81 | 67 | 85 | 60 | 111 | 70 | 60 | 82 | 59 | 52 | 48 |
| Ontario | 109 | 87 | 115 | 119 | 136 | 93 | 89 | 84 | 108 | 100 | 78 |
| Manitoba | 71 | 58 | 70 | 65 | 68 | 59 | 44 | 57 | 37 | 42 | 22 |
| Saskatchewan | 49 | 55 | 49 | 83 | 55 | 47 | 42 | 60 | 37 | 36 | 28 |
| Alberta | 91 | 68 | 93 | 131 | 115 | 101 | 71 | 76 | 70 | 64 | 57 |
| British Columbia | 100 | 79 | 103 | 121 | 99 | 100 | 73 | 66 | 73 | 46 | 44 |
| Northwest Territories and Yukon | 0 | 0 | 1 | 0 | 0 | 0 | 0 | 1 | 0 | 0 | 0 |
| Non-main-track derailment accidents by cars derailed | 523 | 437 | 541 | 599 | 606 | 492 | 401 | 450 | 407 | 351 | 293 |
| 1 car | 319 | 266 | 333 | 383 | 403 | 323 | 251 | 274 | 239 | 206 | 149 |
| 2 cars | 91 | 82 | 91 | 93 | 89 | 83 | 77 | 97 | 84 | 65 | 80 |
| 3 cars | 53 | 31 | 46 | 54 | 39 | 36 | 30 | 34 | 28 | 34 | 21 |
| 4 cars | 26 | 22 | 25 | 28 | 32 | 19 | 18 | 15 | 17 | 17 | 13 |
| 5 to 10 cars | 29 | 31 | 43 | 35 | 32 | 29 | 24 | 27 | 36 | 24 | 25 |
| 11 cars or more | 5 | 5 | 3 | 6 | 11 | 2 | 1 | 3 | 3 | 5 | 5 |
Data extracted 12 March 2026 1 Data are for federally regulated railways and include only those occurrences that are reportable under the TSB Regulations. | |||||||||||
| 2015 | 2016 | 2017 | 2018 | 2019 | 2020 | 2021 | 2022 | 2023 | 2024 | 2025 | |
|---|---|---|---|---|---|---|---|---|---|---|---|
| Crossing accidents | 165 | 133 | 143 | 166 | 178 | 130 | 136 | 161 | 150 | 167 | 160 |
| Public crossings | 131 | 105 | 117 | 135 | 135 | 110 | 114 | 133 | 115 | 132 | 122 |
| Passive warnings | 52 | 36 | 47 | 50 | 49 | 56 | 56 | 55 | 38 | 65 | 57 |
| Automated warnings | 79 | 69 | 70 | 85 | 86 | 54 | 58 | 78 | 77 | 67 | 65 |
| Flashing lights and bells | 37 | 39 | 30 | 44 | 43 | 17 | 24 | 27 | 36 | 32 | 27 |
| Gates | 42 | 29 | 38 | 40 | 42 | 36 | 34 | 51 | 37 | 34 | 36 |
| Other automated warnings | 0 | 1 | 2 | 1 | 1 | 1 | 0 | 0 | 4 | 1 | 2 |
| Private crossings | 28 | 24 | 21 | 30 | 40 | 18 | 22 | 25 | 33 | 30 | 36 |
| Farm crossings | 6 | 4 | 5 | 1 | 3 | 2 | 0 | 3 | 2 | 5 | 2 |
| Fatal accidents | 15 | 16 | 19 | 18 | 26 | 16 | 16 | 14 | 13 | 12 | 16 |
| Persons fatally injured | 15 | 19 | 19 | 19 | 28 | 18 | 17 | 14 | 13 | 12 | 16 |
| Public crossings | 13 | 19 | 19 | 18 | 25 | 18 | 17 | 14 | 10 | 10 | 13 |
| Passive warnings | 2 | 7 | 4 | 3 | 6 | 12 | 5 | 2 | 2 | 4 | 5 |
| Automated warnings | 11 | 12 | 15 | 15 | 19 | 6 | 12 | 12 | 8 | 6 | 8 |
| Flashing lights and bells | 2 | 5 | 3 | 4 | 5 | 1 | 5 | 2 | 2 | 0 | 1 |
| Gates | 9 | 7 | 12 | 11 | 14 | 5 | 7 | 10 | 6 | 5 | 7 |
| Other automated warnings | 0 | 0 | 0 | 0 | 0 | 0 | 0 | 0 | 0 | 1 | 0 |
| Private crossings | 1 | 0 | 0 | 0 | 3 | 0 | 0 | 0 | 3 | 2 | 3 |
| Farm crossings | 1 | 0 | 0 | 1 | 0 | 0 | 0 | 0 | 0 | 0 | 0 |
| Persons seriously injured | 18 | 24 | 22 | 41 | 31 | 12 | 24 | 28 | 18 | 24 | 29 |
| Public crossings | 18 | 21 | 18 | 36 | 25 | 11 | 23 | 27 | 17 | 21 | 26 |
| Passive warnings | 4 | 5 | 9 | 16 | 6 | 3 | 11 | 6 | 1 | 12 | 13 |
| Automated warnings | 14 | 16 | 9 | 20 | 19 | 8 | 12 | 21 | 16 | 9 | 13 |
| Flashing lights and bells | 4 | 8 | 3 | 6 | 9 | 2 | 6 | 6 | 8 | 4 | 8 |
| Gates | 10 | 8 | 6 | 14 | 10 | 6 | 6 | 15 | 6 | 5 | 5 |
| Other automated warnings | 0 | 0 | 0 | 0 | 0 | 0 | 0 | 0 | 2 | 0 | 0 |
| Private crossings | 0 | 3 | 3 | 5 | 6 | 1 | 1 | 1 | 1 | 1 | 3 |
| Farm crossings | 0 | 0 | 1 | 0 | 0 | 0 | 0 | 0 | 0 | 2 | 0 |
| Number of public crossings2 | 13 348 | 13 280 | 13 934 | 13 535 | 13 230 | 12 876 | 12 650 | 12 615 | 12 531 | 12 514 | 12 481 |
| Passive warnings | 7 797 | 7 733 | 8 260 | 7 872 | 7 597 | 7 374 | 7 173 | 7 105 | 6 999 | 6 969 | 6 915 |
| Automated warnings | 5 551 | 5 547 | 5 674 | 5 663 | 5 633 | 5 502 | 5 477 | 5 510 | 5 532 | 5 545 | 5 566 |
| Flashing lights and bells | 3 156 | 3 118 | 3 263 | 3 216 | 3 116 | 2 964 | 2 892 | 2 859 | 2 842 | 2 815 | 2 810 |
| Gates | 2 351 | 2 386 | 2 393 | 2 430 | 2 502 | 2 526 | 2 574 | 2 641 | 2 681 | 2 721 | 2 747 |
| Other automated warnings | 44 | 43 | 18 | 17 | 15 | 12 | 11 | 10 | 9 | 9 | 9 |
Data extracted 12 March 2026 1 Data are for federally regulated railways and include only those occurrences that are reportable under the TSB Regulations. | |||||||||||
| 2015 | 2016 | 2017 | 2018 | 2019 | 2020 | 2021 | 2022 | 2023 | 2024 | 2025 | |
|---|---|---|---|---|---|---|---|---|---|---|---|
| Crossing accidents | 165 | 133 | 143 | 166 | 178 | 130 | 136 | 161 | 150 | 167 | 160 |
| Newfoundland and Labrador | 0 | 0 | 0 | 0 | 0 | 0 | 0 | 0 | 0 | 0 | 0 |
| Nova Scotia | 2 | 1 | 3 | 3 | 2 | 4 | 0 | 2 | 1 | 3 | 1 |
| New Brunswick | 7 | 4 | 1 | 3 | 2 | 1 | 2 | 3 | 2 | 1 | 4 |
| Quebec | 28 | 29 | 26 | 24 | 25 | 20 | 14 | 18 | 21 | 28 | 29 |
| Ontario | 29 | 26 | 26 | 42 | 50 | 20 | 27 | 37 | 28 | 39 | 33 |
| Manitoba | 19 | 14 | 15 | 15 | 20 | 22 | 16 | 13 | 21 | 20 | 17 |
| Saskatchewan | 23 | 19 | 26 | 22 | 24 | 13 | 24 | 29 | 21 | 24 | 13 |
| Alberta | 38 | 21 | 28 | 35 | 35 | 31 | 31 | 33 | 29 | 35 | 37 |
| British Columbia | 19 | 19 | 18 | 22 | 20 | 19 | 21 | 26 | 27 | 17 | 26 |
| Northwest Territories and Yukon | 0 | 0 | 0 | 0 | 0 | 0 | 1 | 0 | 0 | 0 | 0 |
| Crossing accidents on main track2 | 159 | 122 | 137 | 155 | 166 | 124 | 127 | 151 | 142 | 157 | 145 |
| Crossing accidents per million main-track train miles3 | 2.0 | 1.6 | 1.8 | 1.9 | 2.0 | 1.7 | 1.7 | 2.0 | 1.8 | 1.9 | 1.7 |
| Crossing accidents with derailment | 6 | 6 | 5 | 7 | 1 | 3 | 2 | 4 | 6 | 2 | 3 |
| Persons fatally injured | 15 | 19 | 19 | 19 | 28 | 18 | 17 | 14 | 13 | 12 | 16 |
| Newfoundland and Labrador | 0 | 0 | 0 | 0 | 0 | 0 | 0 | 0 | 0 | 0 | 0 |
| Nova Scotia | 0 | 0 | 0 | 0 | 0 | 0 | 0 | 0 | 0 | 0 | 0 |
| New Brunswick | 0 | 2 | 0 | 0 | 0 | 0 | 0 | 0 | 0 | 0 | 0 |
| Quebec | 4 | 3 | 7 | 3 | 2 | 3 | 3 | 0 | 3 | 2 | 1 |
| Ontario | 5 | 3 | 7 | 6 | 11 | 2 | 7 | 4 | 3 | 4 | 6 |
| Manitoba | 1 | 2 | 2 | 1 | 5 | 5 | 1 | 0 | 3 | 1 | 3 |
| Saskatchewan | 0 | 4 | 0 | 1 | 4 | 1 | 0 | 5 | 1 | 3 | 1 |
| Alberta | 3 | 3 | 2 | 3 | 2 | 5 | 6 | 0 | 1 | 2 | 2 |
| British Columbia | 2 | 2 | 1 | 5 | 4 | 2 | 0 | 5 | 2 | 0 | 3 |
| Northwest Territories and Yukon | 0 | 0 | 0 | 0 | 0 | 0 | 0 | 0 | 0 | 0 | 0 |
| Persons seriously injured | 18 | 24 | 22 | 41 | 31 | 12 | 24 | 28 | 18 | 24 | 29 |
| Newfoundland and Labrador | 0 | 0 | 0 | 0 | 0 | 0 | 0 | 0 | 0 | 0 | 0 |
| Nova Scotia | 0 | 0 | 0 | 0 | 2 | 1 | 0 | 0 | 0 | 0 | 3 |
| New Brunswick | 0 | 0 | 0 | 0 | 0 | 0 | 0 | 0 | 0 | 0 | 2 |
| Quebec | 2 | 8 | 3 | 10 | 1 | 2 | 1 | 2 | 0 | 4 | 8 |
| Ontario | 0 | 4 | 2 | 8 | 7 | 1 | 7 | 4 | 8 | 6 | 3 |
| Manitoba | 2 | 3 | 3 | 7 | 0 | 2 | 3 | 4 | 3 | 2 | 4 |
| Saskatchewan | 2 | 2 | 2 | 9 | 7 | 1 | 1 | 6 | 3 | 2 | 0 |
| Alberta | 6 | 6 | 5 | 2 | 9 | 3 | 8 | 9 | 2 | 8 | 6 |
| British Columbia | 6 | 1 | 7 | 5 | 5 | 2 | 4 | 3 | 2 | 2 | 3 |
| Northwest Territories and Yukon | 0 | 0 | 0 | 0 | 0 | 0 | 0 | 0 | 0 | 0 | 0 |
| Number of public crossings4 | 13 348 | 13 280 | 13 934 | 13 535 | 13 230 | 12 876 | 12 650 | 12 615 | 12 531 | 12 514 | 12 481 |
| Newfoundland and Labrador | 5 | 5 | 4 | 5 | 5 | 4 | 6 | 6 | 6 | 6 | 6 |
| Nova Scotia | 117 | 117 | 116 | 116 | 118 | 100 | 100 | 100 | 103 | 103 | 103 |
| New Brunswick | 261 | 261 | 360 | 356 | 312 | 293 | 240 | 238 | 239 | 239 | 245 |
| Quebec | 1 385 | 1 385 | 1 234 | 1 233 | 1 316 | 1 319 | 1 358 | 1 355 | 1 349 | 1 349 | 1 348 |
| Ontario | 2 767 | 2 752 | 3 092 | 2 984 | 2 820 | 2 622 | 2 567 | 2 563 | 2 543 | 2 531 | 2 530 |
| Manitoba | 1 792 | 1 787 | 1 894 | 1 826 | 1 796 | 1 783 | 1 771 | 1 764 | 1 755 | 1 754 | 1 750 |
| Saskatchewan | 3 430 | 3 425 | 3 440 | 3 384 | 3 339 | 3 273 | 3 263 | 3 277 | 3 250 | 3 244 | 3 221 |
| Alberta | 2 465 | 2 448 | 2 619 | 2 497 | 2 469 | 2 455 | 2 366 | 2 365 | 2 350 | 2 353 | 2 342 |
| British Columbia | 1 105 | 1 078 | 1 164 | 1 123 | 1 045 | 1 017 | 954 | 922 | 924 | 923 | 924 |
| Northwest Territories and Yukon | 21 | 22 | 11 | 11 | 10 | 10 | 25 | 25 | 12 | 12 | 12 |
Data extracted 12 March 2026 1 Data are for federally regulated railways and include only those occurrences that are reportable under the TSB Regulations. | |||||||||||
| 2015 | 2016 | 2017 | 2018 | 2019 | 2020 | 2021 | 2022 | 2023 | 2024 | 2025 | |
|---|---|---|---|---|---|---|---|---|---|---|---|
| Trespasser accidents | 50 | 68 | 76 | 68 | 56 | 60 | 63 | 72 | 80 | 95 | 92 |
| Newfoundland and Labrador | 0 | 0 | 0 | 0 | 0 | 0 | 0 | 1 | 0 | 0 | 0 |
| Nova Scotia | 0 | 1 | 1 | 0 | 0 | 2 | 1 | 2 | 0 | 2 | 3 |
| New Brunswick | 1 | 1 | 0 | 0 | 1 | 1 | 1 | 0 | 0 | 1 | 2 |
| Quebec | 5 | 3 | 12 | 12 | 6 | 8 | 6 | 11 | 9 | 9 | 3 |
| Ontario | 23 | 25 | 33 | 30 | 21 | 21 | 35 | 33 | 35 | 33 | 43 |
| Manitoba | 1 | 4 | 4 | 3 | 2 | 3 | 1 | 3 | 6 | 5 | 5 |
| Saskatchewan | 4 | 3 | 1 | 1 | 4 | 1 | 2 | 0 | 4 | 4 | 6 |
| Alberta | 4 | 10 | 8 | 10 | 14 | 12 | 6 | 9 | 9 | 18 | 18 |
| British Columbia | 12 | 21 | 17 | 12 | 8 | 12 | 11 | 13 | 17 | 23 | 12 |
| Northwest Territories and Yukon | 0 | 0 | 0 | 0 | 0 | 0 | 0 | 0 | 0 | 0 | 0 |
| Fatal accidents | 30 | 46 | 51 | 34 | 38 | 40 | 41 | 51 | 53 | 56 | 52 |
| Persons fatally injured | 30 | 47 | 52 | 34 | 38 | 40 | 41 | 51 | 53 | 56 | 53 |
| Newfoundland and Labrador | 0 | 0 | 0 | 0 | 0 | 0 | 0 | 0 | 0 | 0 | 0 |
| Nova Scotia | 0 | 2 | 1 | 0 | 0 | 0 | 0 | 0 | 0 | 2 | 2 |
| New Brunswick | 1 | 0 | 0 | 0 | 0 | 0 | 0 | 0 | 0 | 1 | 1 |
| Quebec | 5 | 2 | 9 | 7 | 4 | 8 | 4 | 8 | 6 | 3 | 2 |
| Ontario | 13 | 19 | 25 | 14 | 16 | 14 | 28 | 29 | 26 | 24 | 26 |
| Manitoba | 1 | 2 | 1 | 2 | 2 | 1 | 1 | 2 | 1 | 2 | 4 |
| Saskatchewan | 1 | 2 | 1 | 0 | 4 | 1 | 1 | 0 | 2 | 2 | 2 |
| Alberta | 3 | 5 | 5 | 4 | 9 | 10 | 2 | 8 | 6 | 9 | 7 |
| British Columbia | 6 | 15 | 10 | 7 | 3 | 6 | 5 | 4 | 12 | 13 | 9 |
| Northwest Territories and Yukon | 0 | 0 | 0 | 0 | 0 | 0 | 0 | 0 | 0 | 0 | 0 |
| Persons seriously injured | 17 | 20 | 22 | 30 | 17 | 20 | 17 | 16 | 20 | 35 | 31 |
| Newfoundland and Labrador | 0 | 0 | 0 | 0 | 0 | 0 | 0 | 1 | 0 | 0 | 0 |
| Nova Scotia | 0 | 0 | 0 | 0 | 0 | 2 | 0 | 1 | 0 | 0 | 1 |
| New Brunswick | 0 | 1 | 0 | 0 | 1 | 1 | 1 | 0 | 0 | 0 | 1 |
| Quebec | 0 | 1 | 3 | 5 | 2 | 0 | 1 | 2 | 3 | 6 | 1 |
| Ontario | 8 | 6 | 8 | 13 | 5 | 7 | 6 | 3 | 7 | 8 | 13 |
| Manitoba | 0 | 2 | 2 | 1 | 0 | 2 | 0 | 1 | 4 | 3 | 1 |
| Saskatchewan | 4 | 1 | 0 | 1 | 0 | 0 | 0 | 0 | 1 | 1 | 3 |
| Alberta | 1 | 4 | 2 | 6 | 4 | 2 | 2 | 1 | 1 | 8 | 9 |
| British Columbia | 4 | 5 | 7 | 4 | 5 | 6 | 7 | 7 | 4 | 9 | 2 |
| Northwest Territories and Yukon | 0 | 0 | 0 | 0 | 0 | 0 | 0 | 0 | 0 | 0 | 0 |
Data extracted 12 March 2026 1 Data are for federally regulated railways and include only those occurrences that are reportable under the TSB Regulations. | |||||||||||
Definitions
The following definitions are based on the Canadian Transportation Accident Investigation and Safety Board Act and the associated regulations, as well as the TSB Policy on Occurrence Classification, and apply to the rail transportation occurrences reported pursuant to them.
Occurrence
- Any accident or incident associated with the operation of rolling stock on a railway
- Any situation or condition that the Board has reasonable grounds to believe could, if left unattended, induce an accident or incident described below.
Reportable accident
- A person is killed or sustains a serious injury as a result of
- getting on or off or being on board the rolling stock, or
- coming into direct contact with any part of the rolling stock or its contents
- The rolling stock or its contents
- are involved in a collision and/or a derailment resulting in damages to rolling stock and/or track infrastructure,
- sustain damage that affects the safe operation of the rolling stock,
- sustain a fire or explosion, or
- cause damage to the railway that poses a threat to the safe passage of rolling stock or to the safety of any person, property or the environment
Reportable incident
- A risk of collision occurs between rolling stock
- An unprotected main-track switch or subdivision track switch is left in an abnormal position
- A railway signal displays a less restrictive indication than that required for the intended movement of rolling stock
- Rolling stock occupies a main track or subdivision track, or track work takes place, in contravention of the rules or any regulations made under the Railway Safety Act
- Rolling stock passes a signal indicating stop in contravention of the rules or any regulations made under the Railway Safety Act
- There is an unplanned and uncontrolled movement of rolling stock
- A crew member whose duties are directly related to the safe operation of the rolling stock is unable to perform their duties as a result of a physical incapacitation which poses a threat to the safety of persons, property or the environment
- The rolling stock is involved in a minor collision and/or minor derailment (1 or 2 cars) resulting in no damages
- Rolling stock or its contents cause a fire along, or adjacent to, a railway right-of-way.
Serious injury
- A fracture of any bone, except simple fractures of fingers, toes or the nose
- Lacerations that cause severe hemorrhage or nerve, muscle or tendon damage
- An injury to an internal organ
- Second- or third-degree burns, or any burns affecting more than 5% of the body surface
- A verified exposure to infectious substances or injurious radiation
- An injury that is likely to require hospitalization
Dangerous goods involvement
“Dangerous goods” has the same meaning as in section 2 of the Transportation of Dangerous Goods Act. An accident is considered to have dangerous goods involvement if any car in the consist carrying (or having last contained) a dangerous good derails, strikes or is struck by any other rolling stock or object. It does not mean that there was any release of any product. Also included are crossing accidents in which the motor vehicle involved (e.g., tanker truck) is carrying a dangerous good.
Derailment
Any instance where one or more wheels of rolling stock have come off the normal running surface of the rail.